ES 5-6-13
Today is the 3 year anniversary of the 2010 Flash Crash. I doubt that this has any significance in today's market but we love to remember the anniversary of dramatic market events. Perhaps we're a bunch of drama queens .
Click image for original size
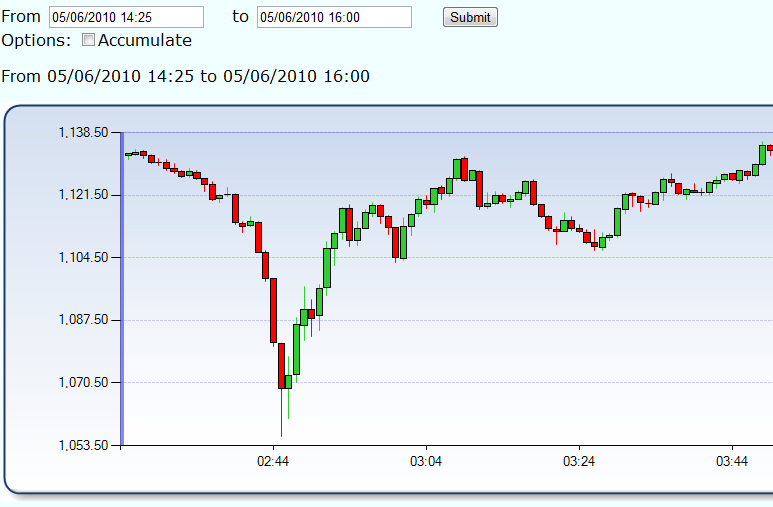
here are the numbers I am working from today. Should have said "Under fridays lows" at one point on the video just to clarify...
watch out for the potential "Z" day at least early on with no reports happening....they may just try and torture us with continued two sided trade . Just like fridays day session and the meager 4 point range in the overnight
For me I am using that 09 more as a magnet ..usually I would use a VA low for trade initiation but because we had high volume and the close of Friday there it is less attractive but best use as a magnet price.
although I don't like selling at a POC, I will try small sells in RTH on any first push up as long as the 09 hasn't printed yet...better sells come above that VA high and that double top...so my plan would be to be more aggressive up there
Ideally i'd like to see 2- 2.5 points between my entry and that 09 target to make the sells worth taking
Ideally i'd like to see 2- 2.5 points between my entry and that 09 target to make the sells worth taking
I'm starting my hunt for shorts in this 1612 area...plus 2.5 is here and plus 4 - 5.5 will take out Fridays highs
they don't usually run it up two days in a row from the opening..!!
they don't usually run it up two days in a row from the opening..!!
I'd like to see a second failure outside the VA high of friday but we know that double top is there too...so if you are selling up here than have part of your plan the idea to take the better shorts outside that high near the plus4 - 5.5
they seem to running it back after 3 hh or 3 LL on the 5 minute today...classic consolidation so far
gap in the data at 1611 too
they seem to running it back after 3 hh or 3 LL on the 5 minute today...classic consolidation so far
gap in the data at 1611 too
there may come a point where us VA traders cover and then they will push out fridays highs rather quickly...that to me is not real buyers...just us folks caught the wrong waq...so when we are done covering price comes back down
all my shorts now are using the LVN and gap in data at 1611 as a target...I really want them to flush out the stops up here to make it look like buying has entered
the plus 4 will push out that double top...I'm standing by for new highs now to look for shorts
4 bars with the same 5 minute low at 09.75 !!
I'm bored.
Can't you hack into AP twitter account and get something going?
seriously, if we finish the day like we've started it (inside yesterday's range) this day is like a spring that is coiling.
tomorrow (or overnight) could be a breakout and run.
Can't you hack into AP twitter account and get something going?
seriously, if we finish the day like we've started it (inside yesterday's range) this day is like a spring that is coiling.
tomorrow (or overnight) could be a breakout and run.
gheesh..my comcast account is frozen and can't get emails....I sure wish they would have popped out fridays highs by now....
Twice the IB comes in at 1618 area which goes well with the RAT and R2 level for today...maybe something can happen there..otherwise all the volume today is in the lower part of Fridays VA range at the 1610 area now...below the POC of time from friday too...that makes it harder for me to take any longs up here even though that poor high is up there
It sucks when we have conflicting chart points - for me it is the multiple lows at 09.75 and that crappy high from Friday..I'm trying to be patient and not overtrade in this thin volume..
Originally posted by PAUL9
I'm bored.
Can't you hack into AP twitter account and get something going?
seriously, if we finish the day like we've started it (inside yesterday's range) this day is like a spring that is coiling.
tomorrow (or overnight) could be a breakout and run.
this is one of the ugliest profiles i have seen in a while...ledges at 1612.50 and down near 09.75....it's just GROSS !!! LOL!!
Emini Day Trading /
Daily Notes /
Forecast /
Economic Events /
Search /
Terms and Conditions /
Disclaimer /
Books /
Online Books /
Site Map /
Contact /
Privacy Policy /
Links /
About /
Day Trading Forum /
Investment Calculators /
Pivot Point Calculator /
Market Profile Generator /
Fibonacci Calculator /
Mailing List /
Advertise Here /
Articles /
Financial Terms /
Brokers /
Software /
Holidays /
Stock Split Calendar /
Mortgage Calculator /
Donate
Copyright © 2004-2023, MyPivots. All rights reserved.
Copyright © 2004-2023, MyPivots. All rights reserved.