RO
roofer
Rep: 3,689
Posts: 3,574
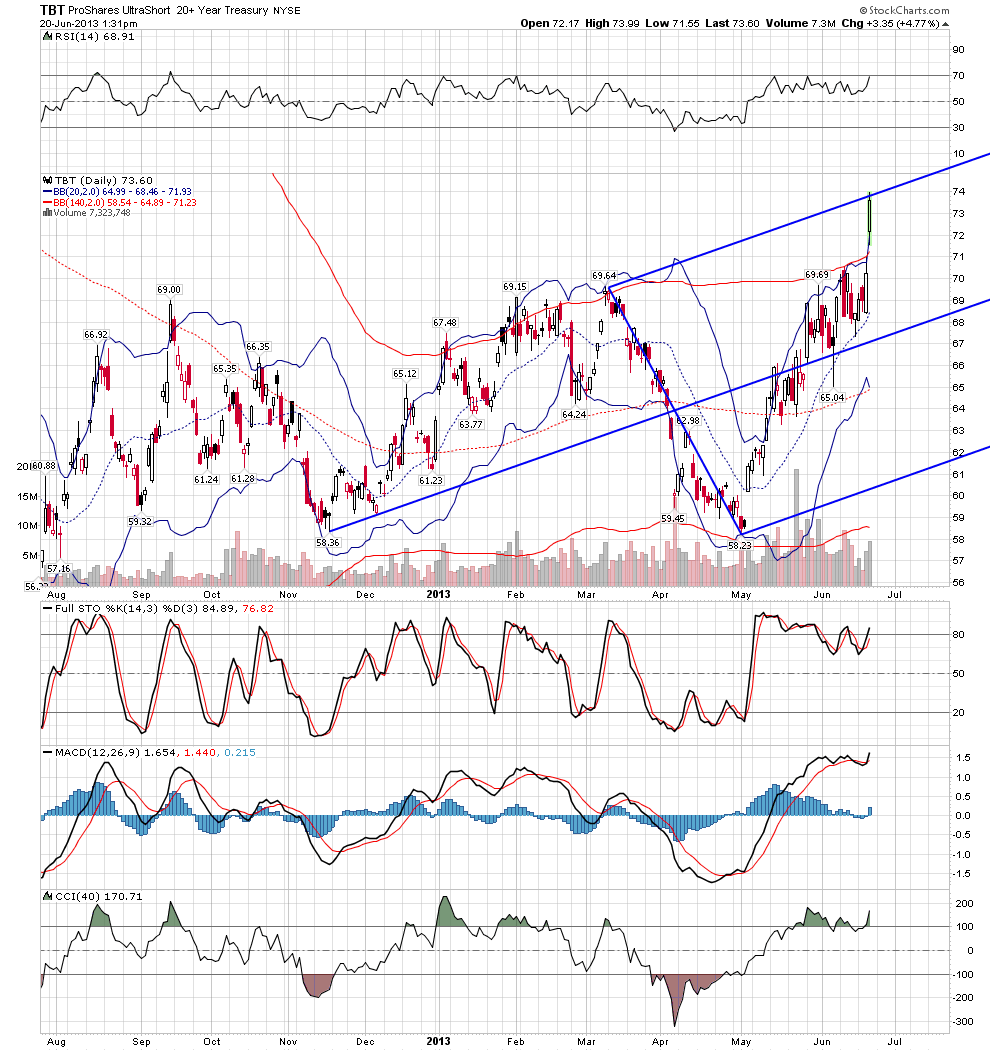
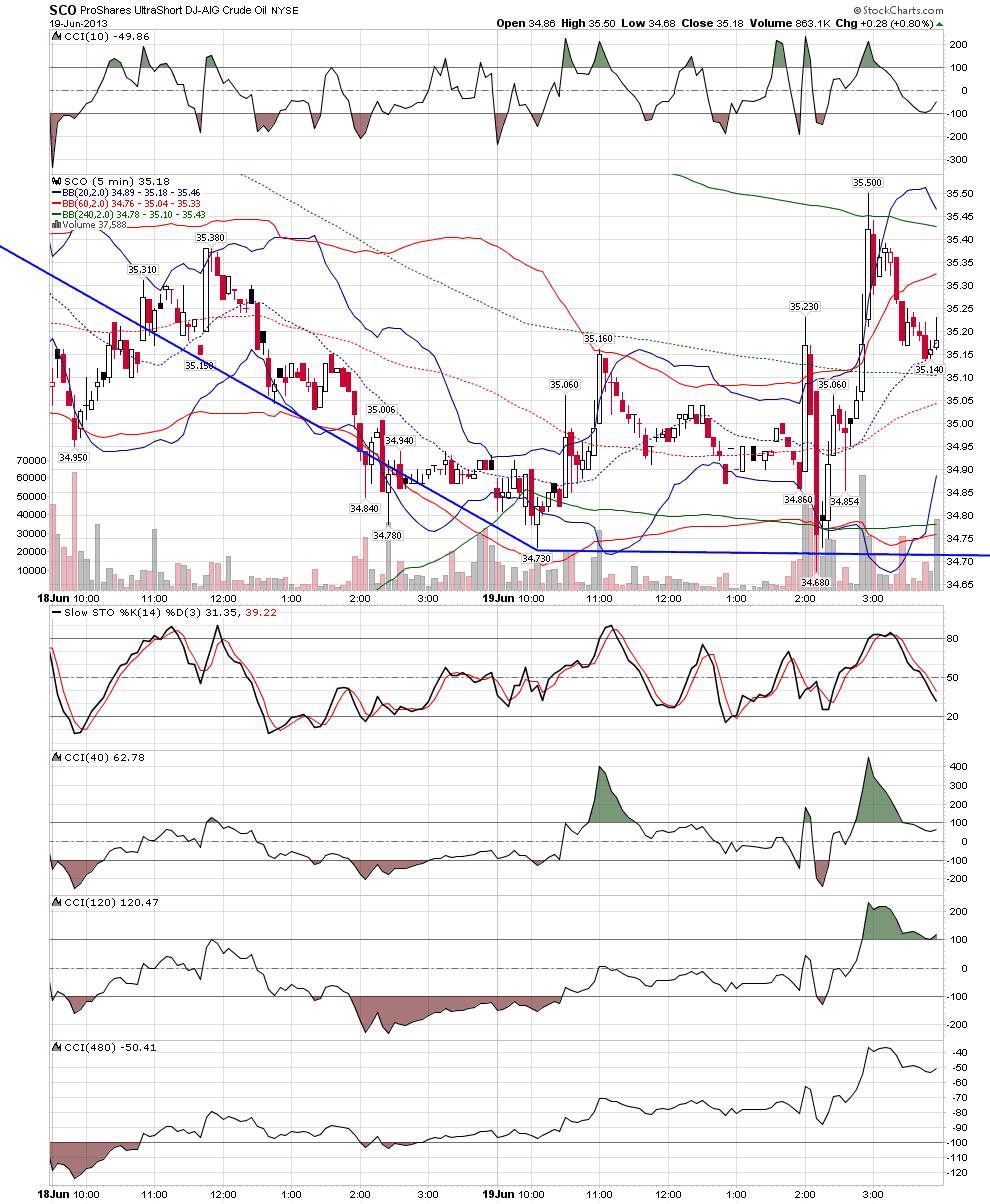
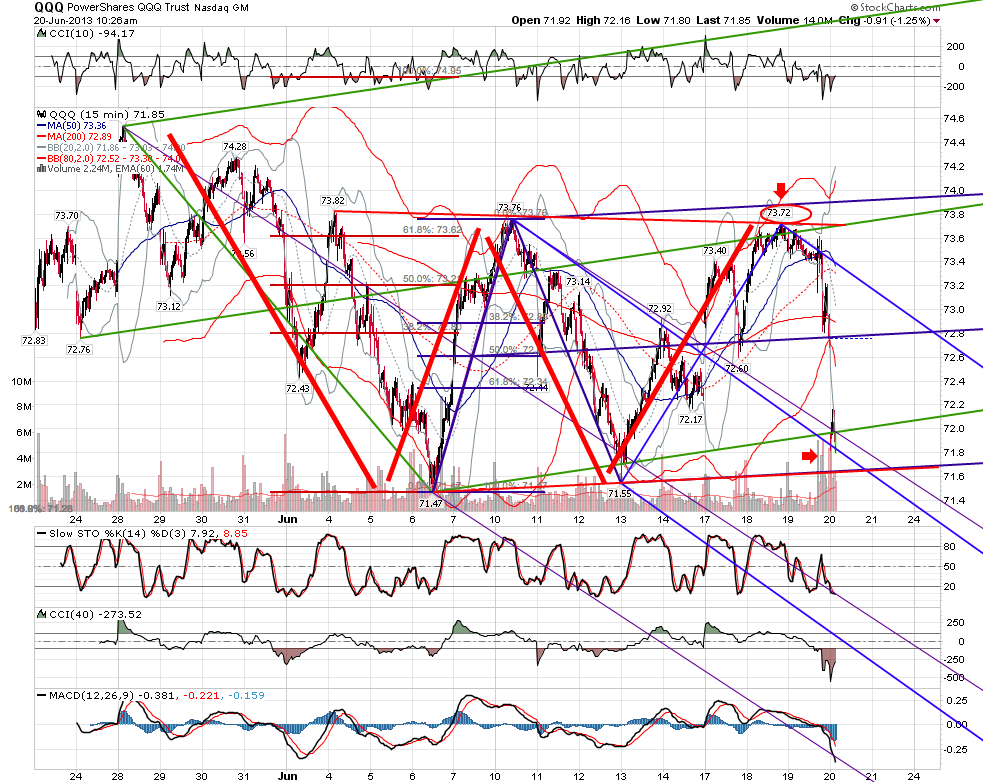
i will take a trade idea from anywhere but only trade it if confirmed by the tools.. gann said that it is our job as traders to know the personality of each thing we trade... in trading oil etf;s, i expect them to gun stops to new price low before price goes higher... the trader joed had a turn called for in crude. so i drew my lines and waited for the setup.note how price gunned the stop as expected at the line given by the tools in SCO
Click image for original size
RA
rat89
Rep: 0
Posts: 7,015
very interesting and tricky stuff going on....all good though
Click image for original size
RO
roofer
Rep: 3,689
Posts: 3,574
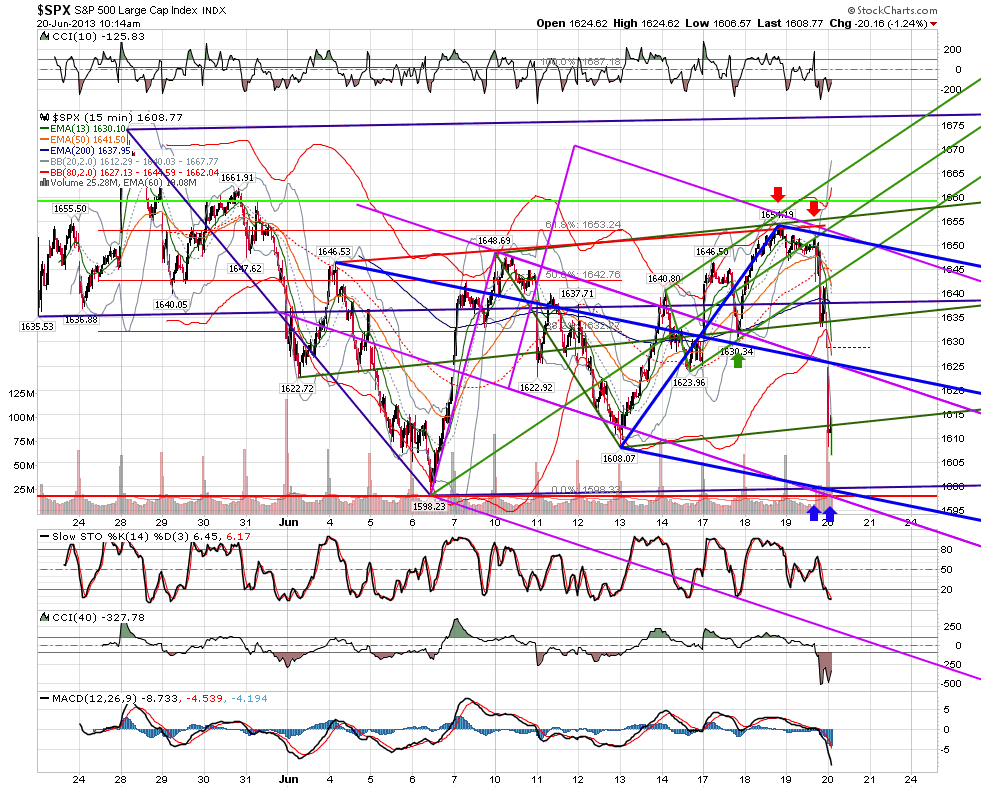
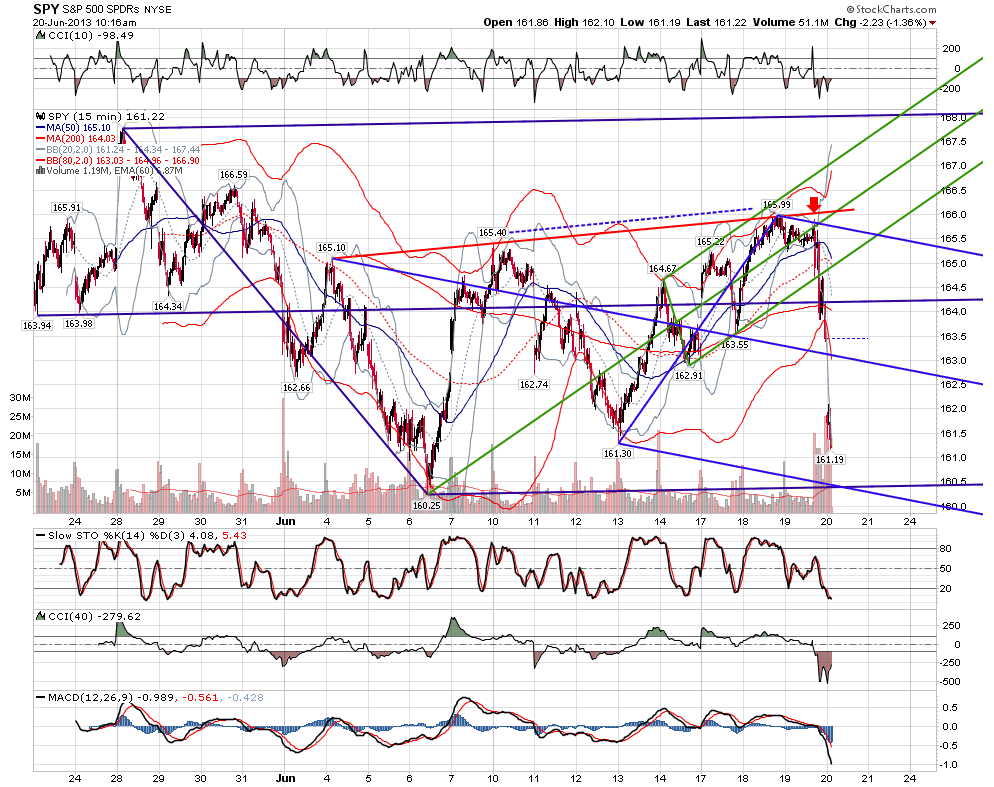
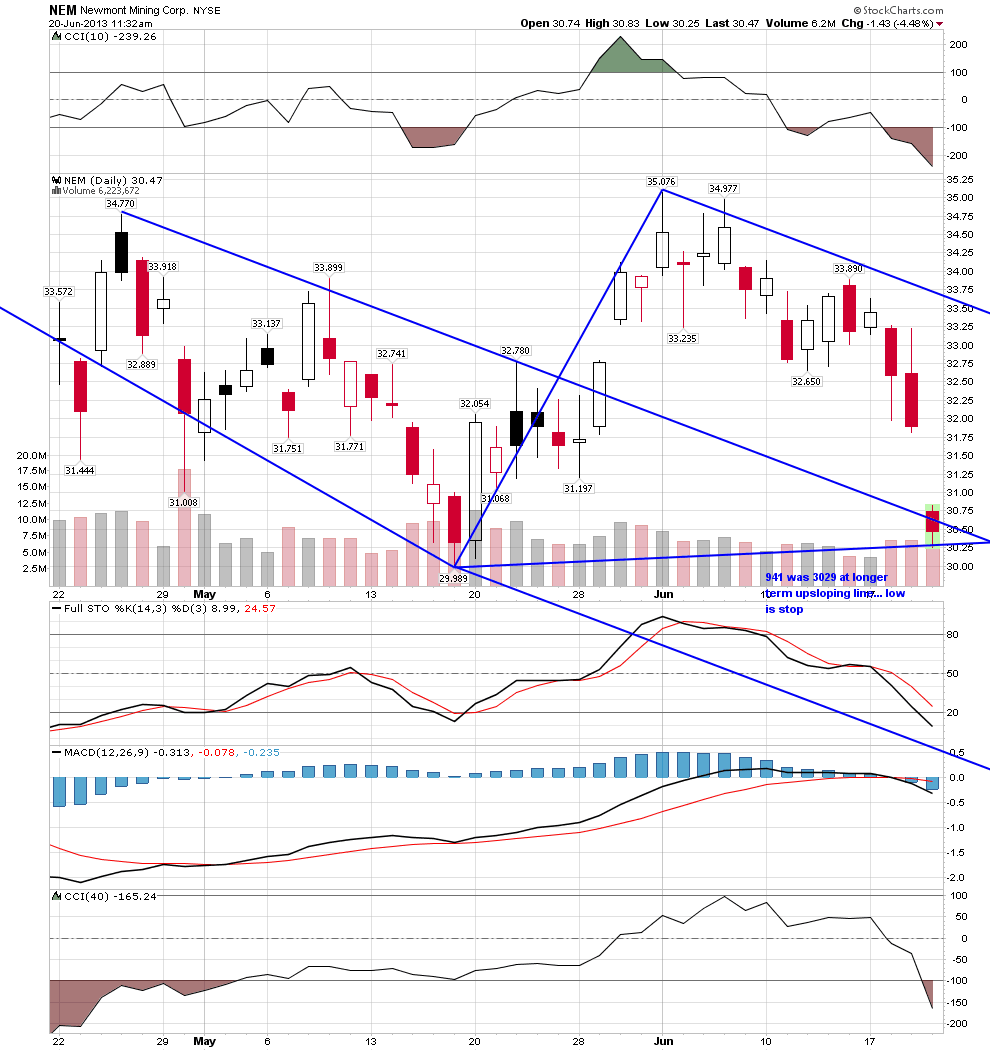
with all my longer term charts at make or break levels in metals stocks i did something this morning that i had not done in years... bought for a buy and hold. i will let you know if i get stopped out...
JI
jimkane
Rep: 3,058
Posts: 33,089
Here's that same silver chart from way back, with the same hash mark on there from before. Notice the 3D into the area. The question is, now what? I'm not sure this will hold. But, can I really see silver in the low 10's? If the ES is headed to 2000 by year end, maybe (and maybe even if the ES is now in a bear market). Lots and lots and lots of bottom callers here for the PM's, though, on every blog I read (except maybe one). My gut says more manipulation down...
As an aside, if I'm thinking about stacking (buying physical for holding regardless of future price, in preparation for 'the collapse'), then I'm liking this spot, even if silver does get hammered down. This is one situation where dollar cost averaging down makes sense to me. Just a thought.
Chart created on QCharts, courtesy eSignal
As an aside, if I'm thinking about stacking (buying physical for holding regardless of future price, in preparation for 'the collapse'), then I'm liking this spot, even if silver does get hammered down. This is one situation where dollar cost averaging down makes sense to me. Just a thought.
Click image for original size
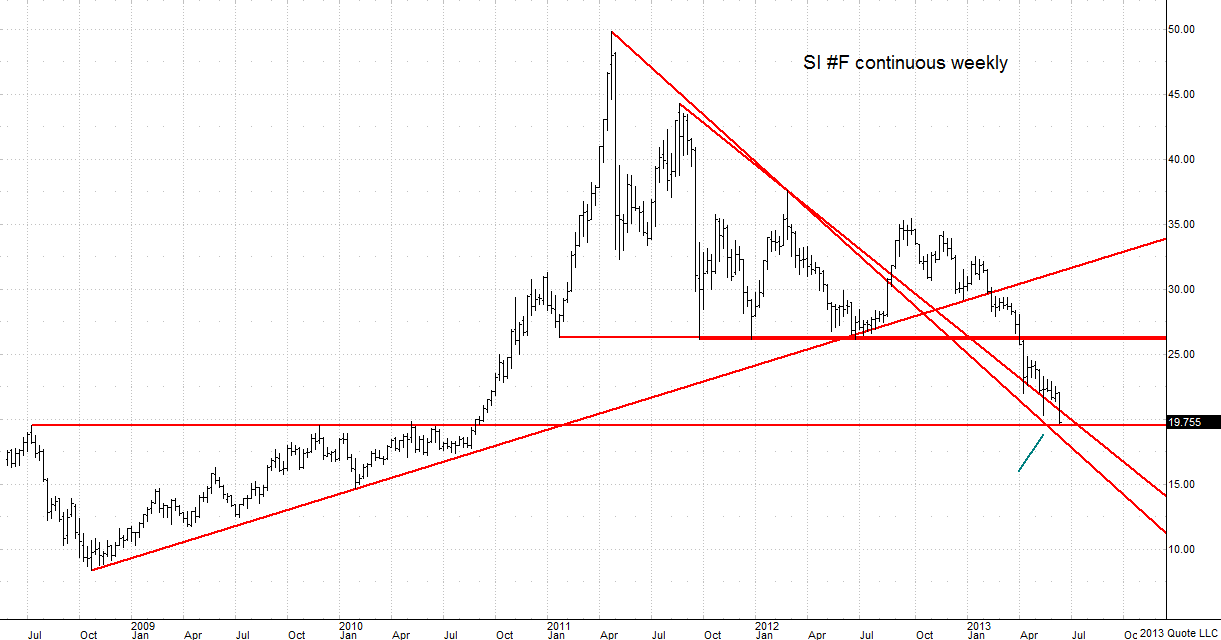
Chart created on QCharts, courtesy eSignal
JI
jimkane
Rep: 3,058
Posts: 33,089
So, did you take the stop when it took out that low and traded 30.10? I guess that's the plan, but I struggle so much with stops when they are that tight...
Originally posted by roofer
Click image for original size