JI
jimkane
Rep: 3,058
Posts: 33,089
74-75 is a key spot, and then down to 67-69. Somewhere in there, if they can't start it up here.
JI
jimkane
Rep: 3,058
Posts: 33,089
Now a bounce to around 86 and down would be very interesting, but if they move it that much the rampers would probably take control...
AL
albert
Rep: 99
Posts: 3,094
Originally posted by jimkane
Hey, roofer, I just discovered something on NEM and wanted your thoughts. I did my work on NEM, and found the low on May 17th by eSignal data was 30.30, which we are well below now. I checked Big Charts and Bloomberg, and they both also have 30.30. I suspect Stock Charts may have incorrect data for that low. If so, NEM has violated your condition. It can be a real issue for us traders if our data is wrong. We live and die by the data. Anyway, I'm not sure where else to check, but if we have some other data feeds out there maybe some people can post what they have. Thoughts?
I get 30.30 for low of day, NEM 05/17/13, IB data.
Al Kamego
JI
jimkane
Rep: 3,058
Posts: 33,089
I was typing fast there. The best area is 87-89 for that bounce. It starts at 86, but gets better a bit further up. But like I said, any bounce here might invoke the ghosts of the rampers.
JI
jimkane
Rep: 3,058
Posts: 33,089
Thanks, Al, one additional data vendor. I think Stock Charts is likely mistaken. I've been in this very situation myself a few times, where I created a premise based on the data, only to find the data had an error and I had to rethink, based on the situation as it stood at that moment. I'm thinking roofer has long since been stopped out on this flush with the original stop, or even sooner if he has been reading all this. We shall see.
Originally posted by albert
Originally posted by jimkane
Hey, roofer, I just discovered something on NEM and wanted your thoughts. I did my work on NEM, and found the low on May 17th by eSignal data was 30.30, which we are well below now. I checked Big Charts and Bloomberg, and they both also have 30.30. I suspect Stock Charts may have incorrect data for that low. If so, NEM has violated your condition. It can be a real issue for us traders if our data is wrong. We live and die by the data. Anyway, I'm not sure where else to check, but if we have some other data feeds out there maybe some people can post what they have. Thoughts?
I get 30.30 for low of day, NEM 05/17/13, IB data.
Al Kamego
JI
jimkane
Rep: 3,058
Posts: 33,089
86.75, within a tick of the last correction, draws a reaction. But, will the downtrend continue from there, we shall soon see. You know what I want...
JI
jimkane
Rep: 3,058
Posts: 33,089
I'd think they'd come in on this higher low area here. But, maybe the bull's back is finally broken. Without Benny saying he'll come up with more Benny Bucks, maybe they are getting scared. Remember, no increase is tantamount to a decrease. It takes more and more juice to hold this up, so the same is like a decrease. To make it rise or even stay the same, they must go over the $85 billion/month. At some point they will do that I am 100% sure (an opinion, but a strong one), but where will we be by then?
JI
jimkane
Rep: 3,058
Posts: 33,089
Here's an update. Remember how far in advance I posted this? Wow.
Chart created on QCharts, courtesy eSignal
Click image for original size
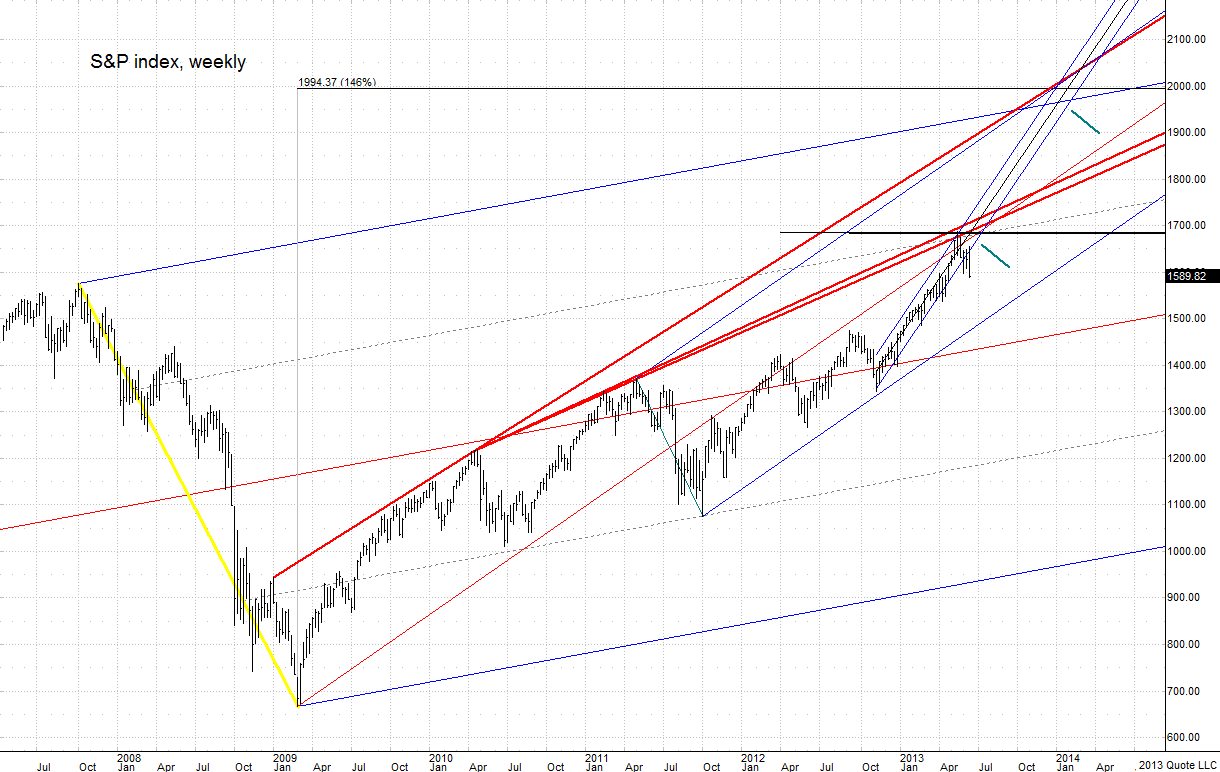
Chart created on QCharts, courtesy eSignal