Here is a new topic.
Al Kamego
JI
jimkane
Rep: 3,058
Posts: 33,089
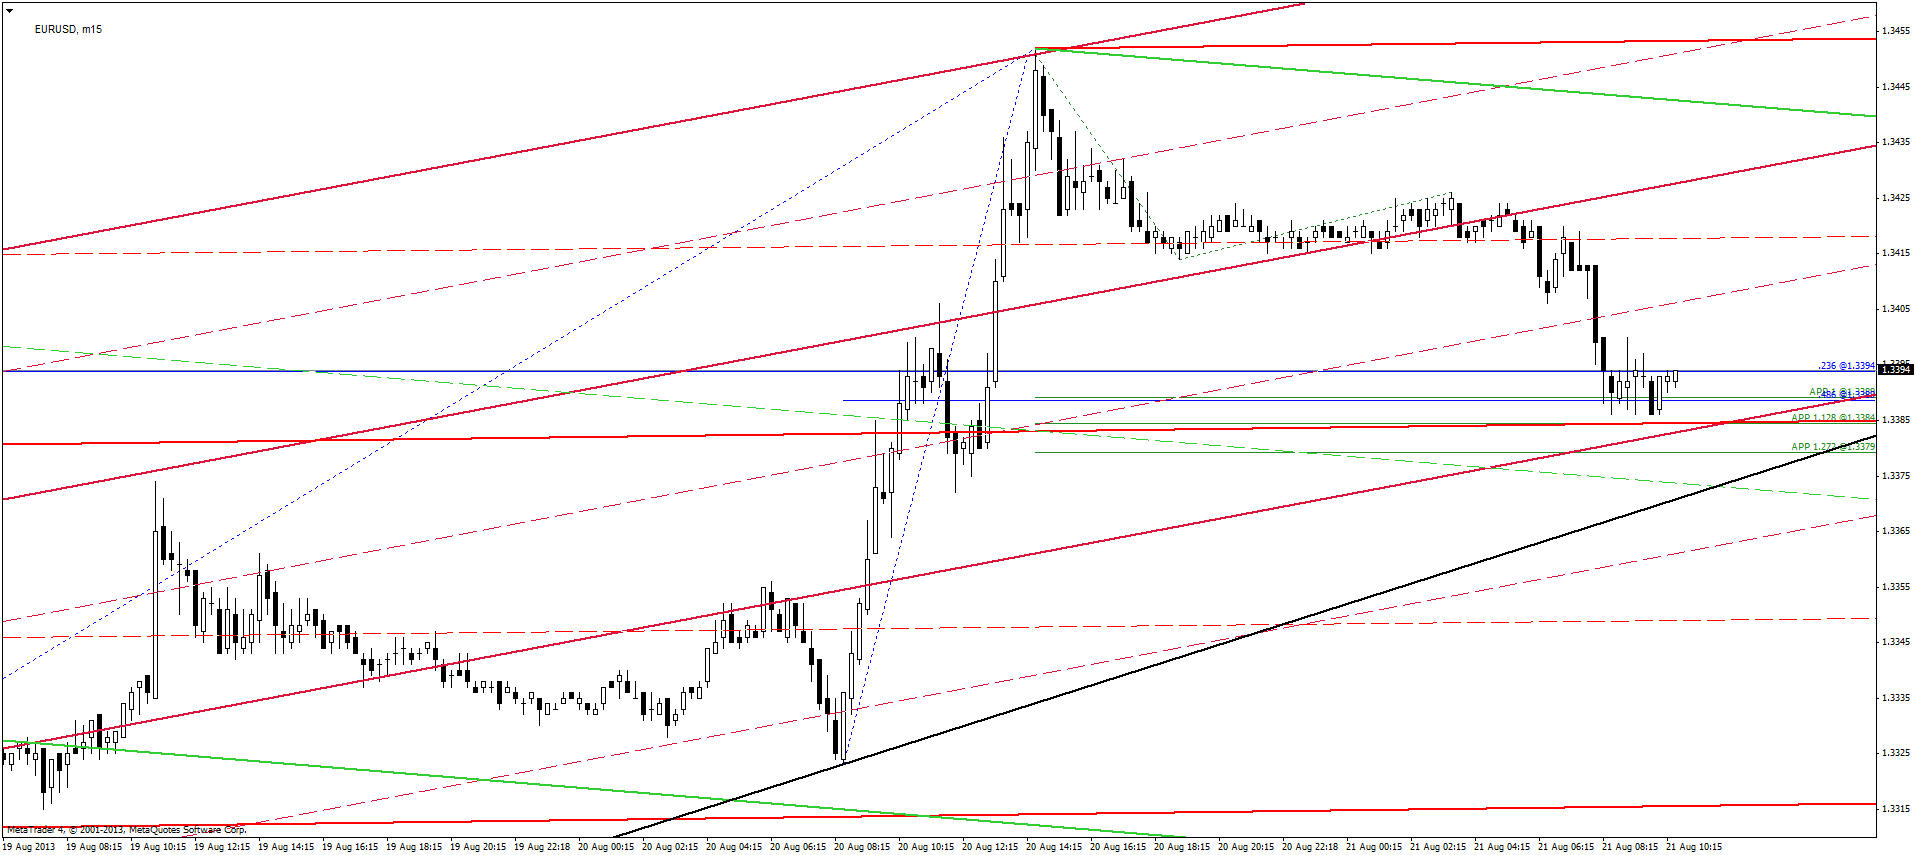
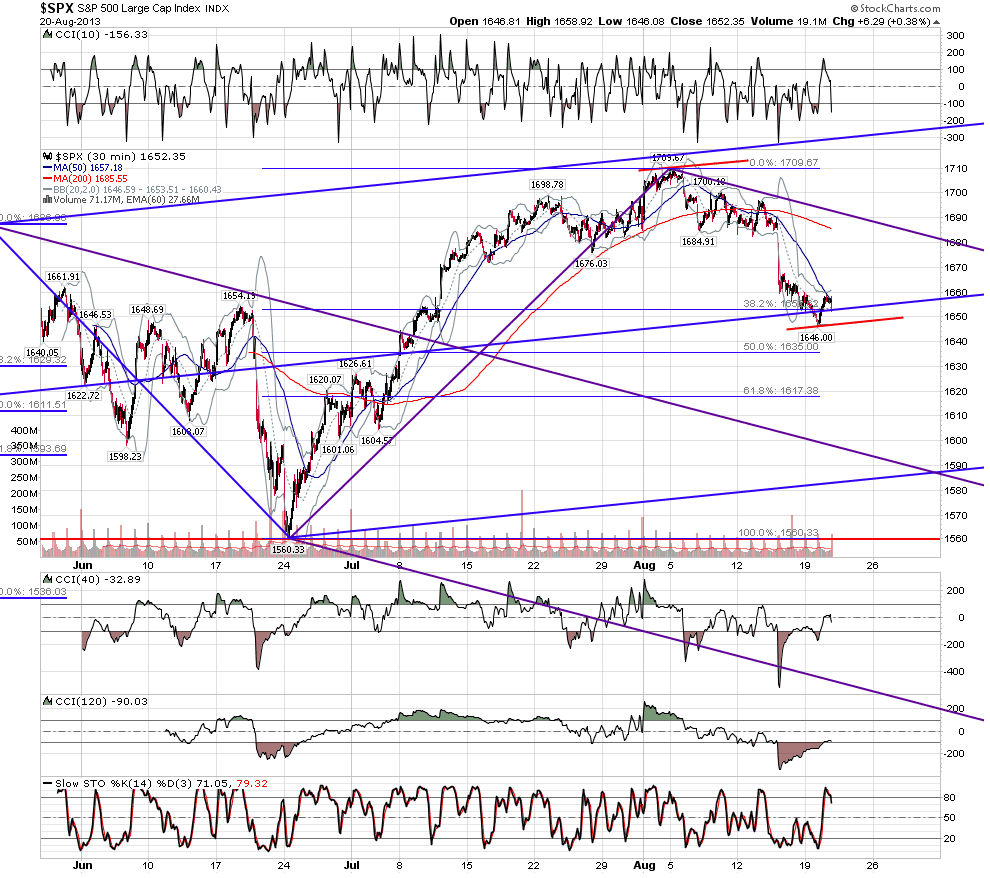
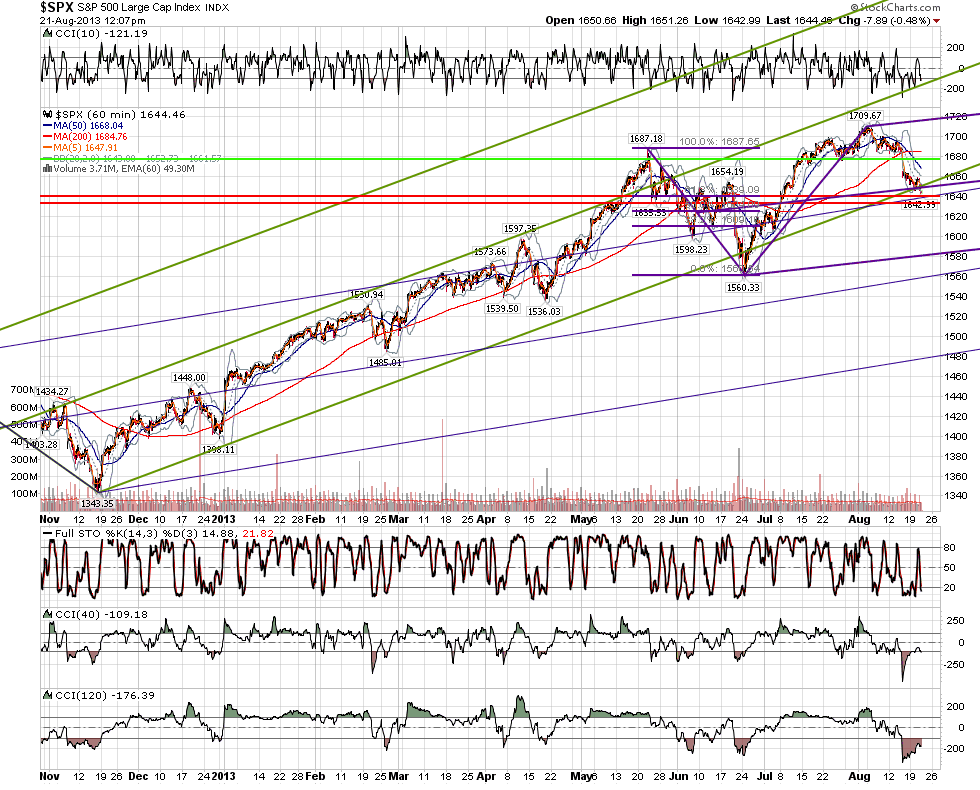
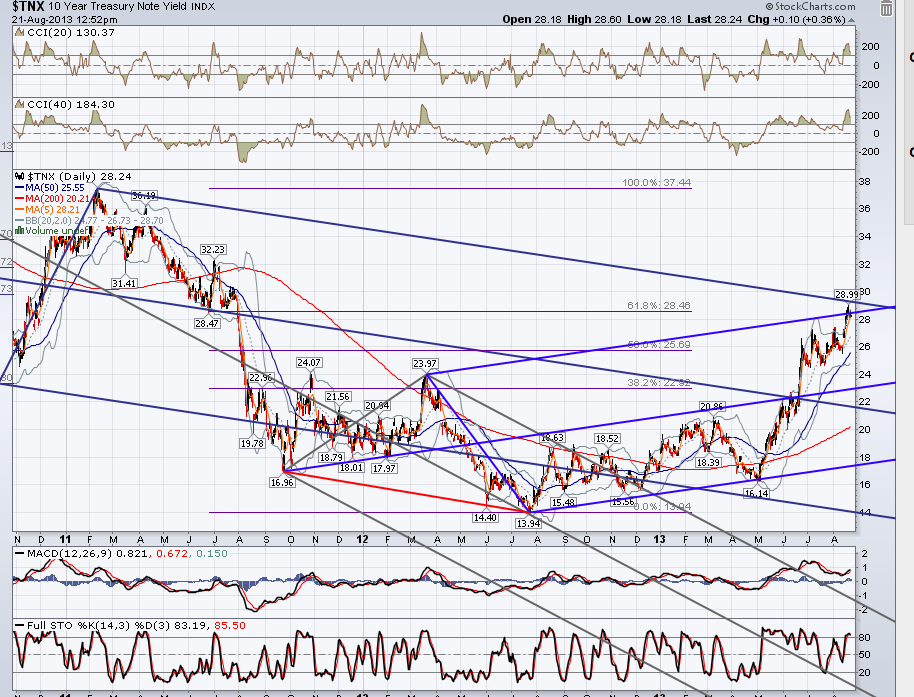
I'm just going to make this one more post tonight. I've noticed that there seems to be no harmonicity in here tonight. No alignments, nothing. This is very unusual, to see things so out of sync. I see this from time to time, but not often. On the very short-term here to short-term, nothing is lining up right now down here. I just want to get that out there, as it has my attention.
I can't say what it means. Maybe it means nothing. Maybe it means everything. All I know is I see it, and I'm on red alert. Hey, maybe that 47.00 is it after the 5-wave down, up it goes, trend on, as expected. But, in case that's not the game it is playing I'm really watching it closely. I'm also keeping an eye out for a possible lower move here for a deeper retest before it moves up (I think 47.00 is more likely it, though).
I can't say what it means. Maybe it means nothing. Maybe it means everything. All I know is I see it, and I'm on red alert. Hey, maybe that 47.00 is it after the 5-wave down, up it goes, trend on, as expected. But, in case that's not the game it is playing I'm really watching it closely. I'm also keeping an eye out for a possible lower move here for a deeper retest before it moves up (I think 47.00 is more likely it, though).
RO
roofer
Rep: 3,689
Posts: 3,574
splits and inverse splits in etf's often preceed increased volatility... it will be interesting to see if that is true in the coming days in the 3x gld share etf's... as always.... who benefits from the 10 to 1 inverse split in NUGT?
ER
EricD
Rep: 63
Posts: 692
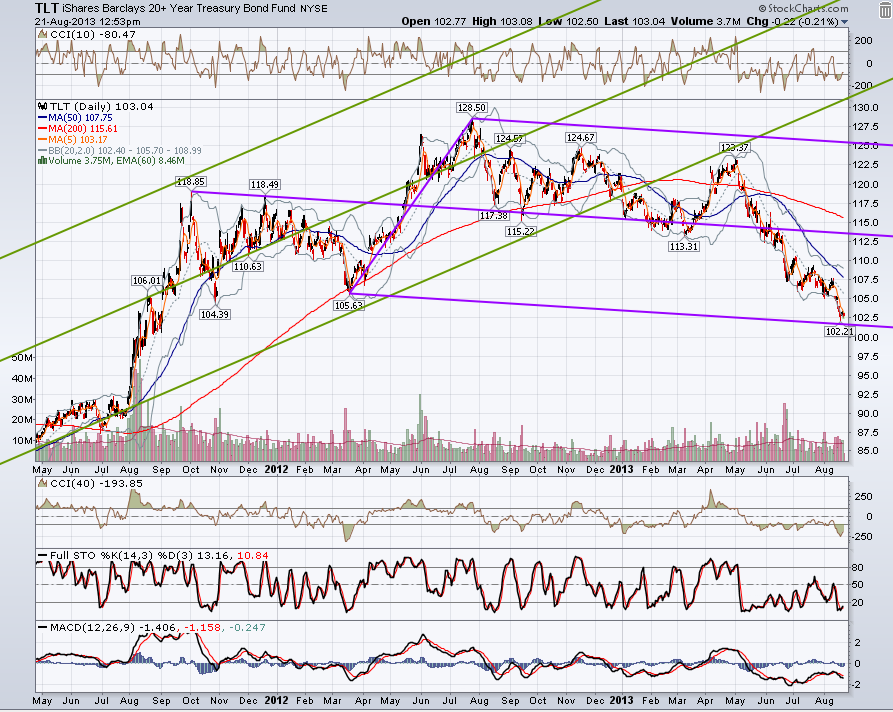
I am curious If it makes new lows how it will handle the .447 .....from say 40-34.50 ?
JI
jimkane
Rep: 3,058
Posts: 33,089
Alright, I'll finish with a little visual. Make sure you look at all the posts and the timestamps. Look on a 1-min. This chart is just a guide for what I was saying. Look at it all. They do this all the time, but especially on a Friday when it sets up like this and is dead at the times of day this was.
Chart created on QCharts, courtesy eSignal
Click image for original size
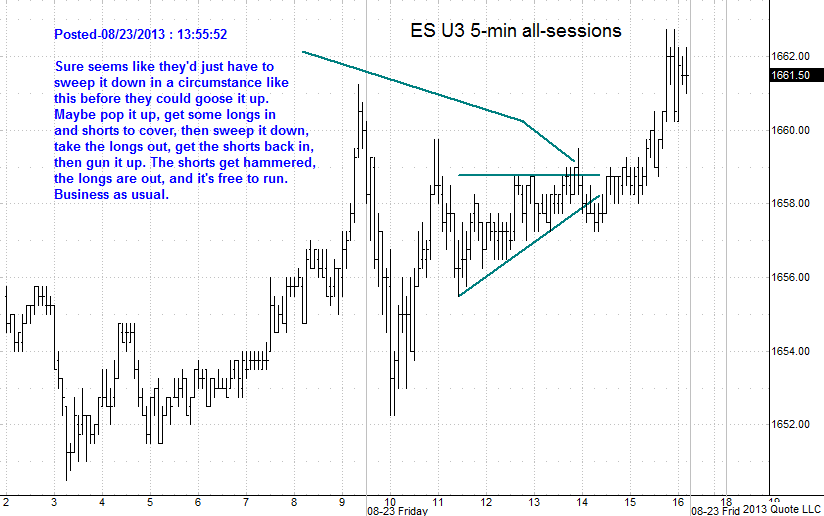
Chart created on QCharts, courtesy eSignal