Here is a new topic.
Al Kamego
ER
EricD
Rep: 63
Posts: 692
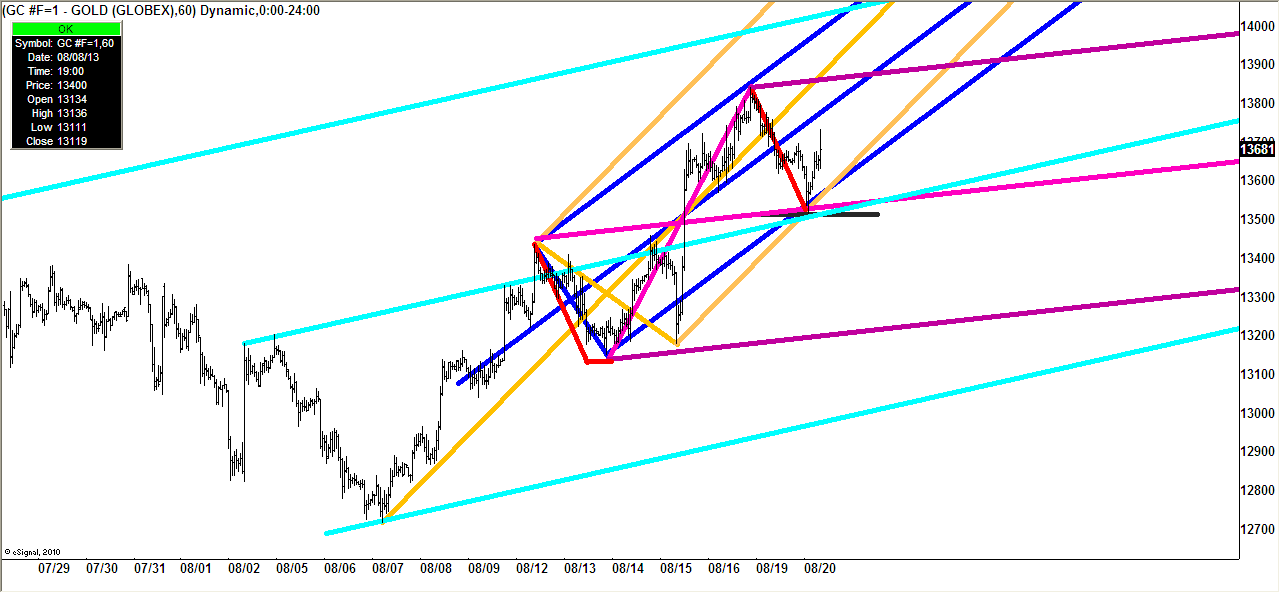
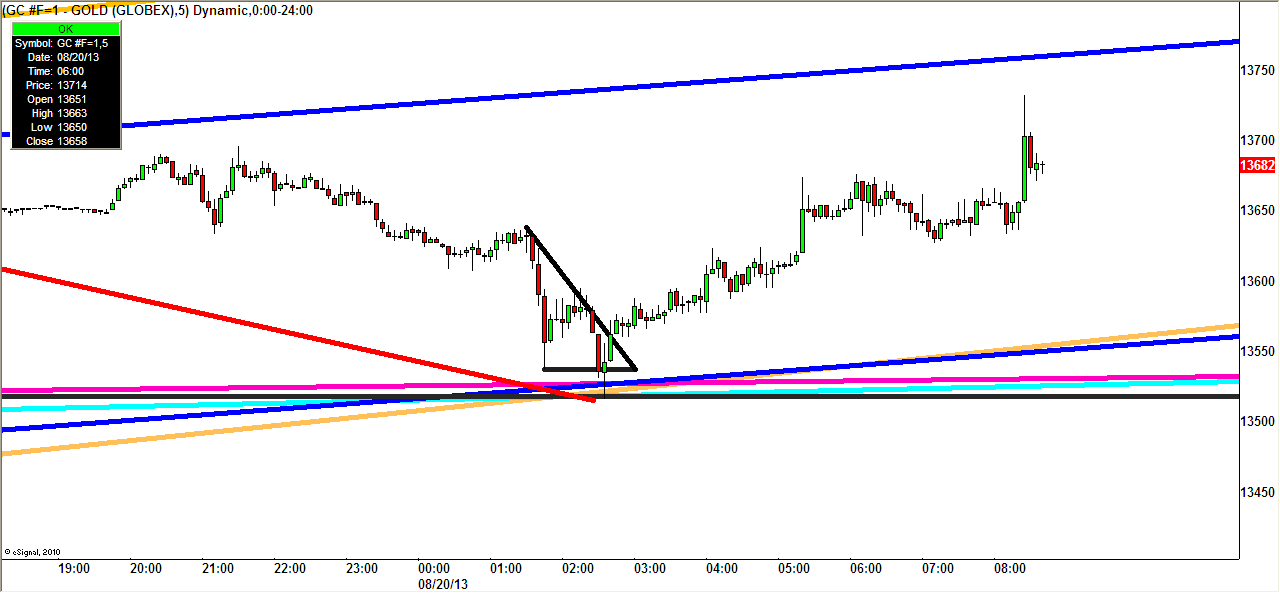
great Gold Chart Marcin......Kane Traders all over it...
Click image for original size
Click image for original size
MA
MarcinO
Rep: 67
Posts: 5,506
Thanks Eric. I like your charts.
I wonder if it gets to the TL at about 1380.
I wonder if it gets to the TL at about 1380.
MA
MarcinO
Rep: 67
Posts: 5,506
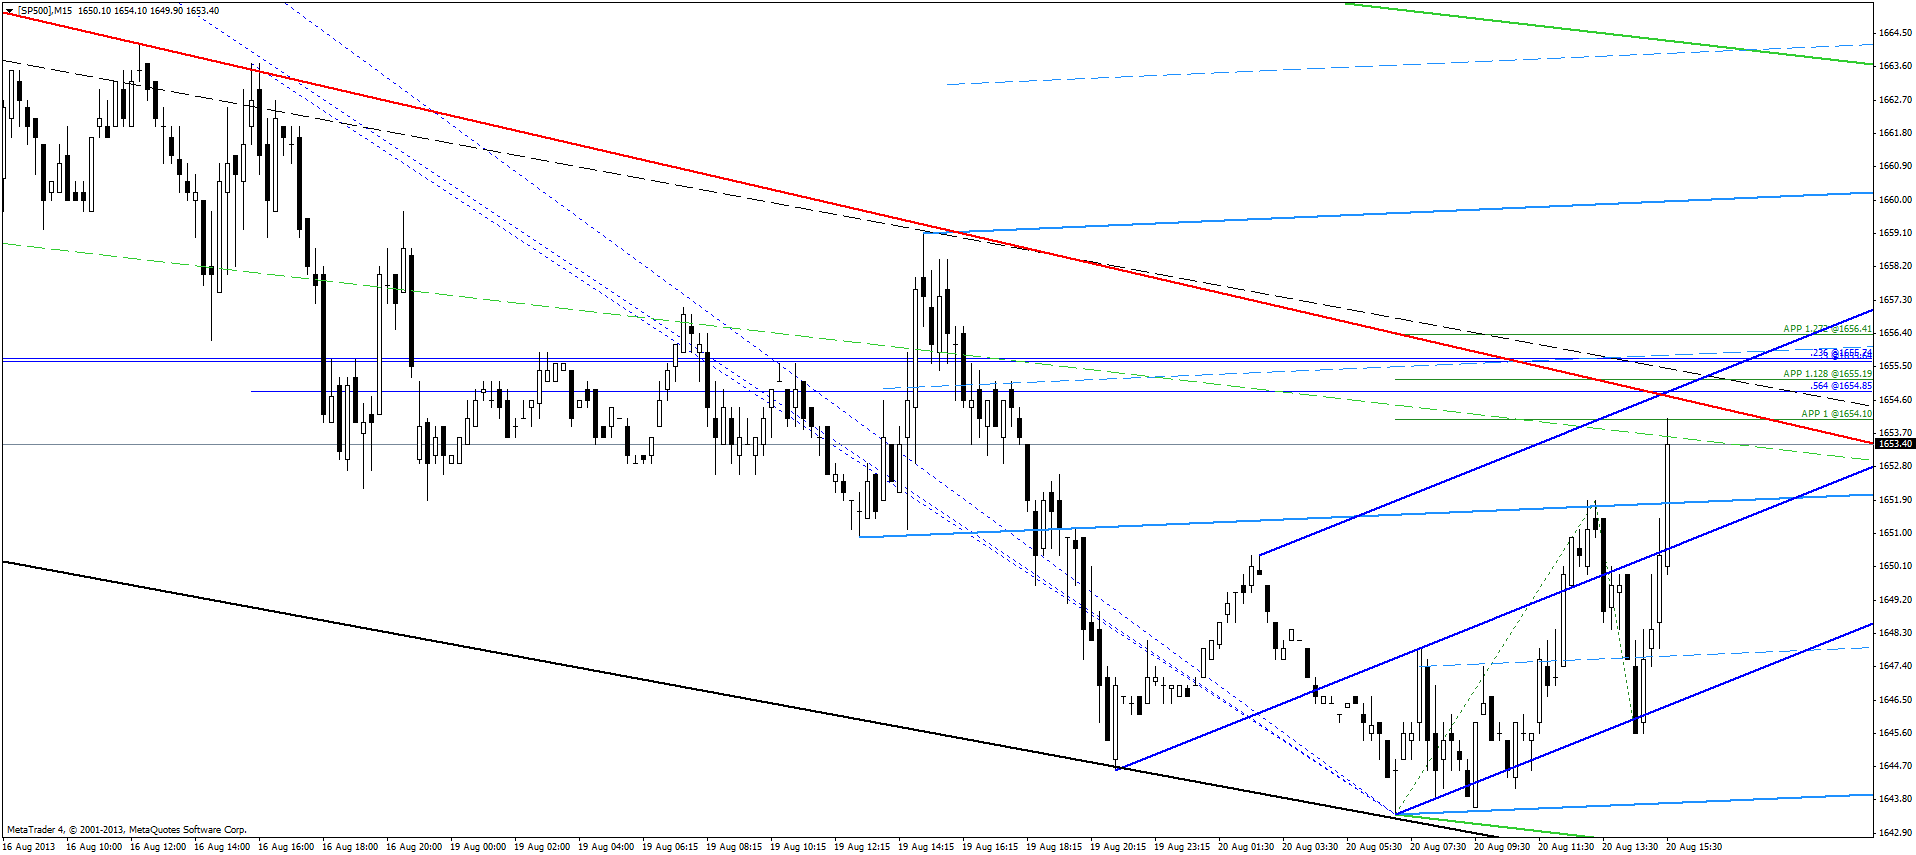
Let's see it this ABCD is enough to drive the ES below 1640.
The middle of the PTA in my CFD is equivalent to 1657-58 in ES.
The middle of the PTA in my CFD is equivalent to 1657-58 in ES.
Click image for original size
JI
jimkane
Rep: 3,058
Posts: 33,089
I hope everyone understands I'm just playing with this post, having some fun.
Remember the cadence of that old TV commercial that shows someone cracking an egg into a frying pan and saying:
This is your brain...
This is your brain on drugs...
Any questions?
Here's my version:
This is the 40-42 ES area mentioned endlessly...
This is the ES reversing at 41...
Any questions?
Now, who knows if it will really get going or not. I have my areas, both very short-term and short-term, and even some intermediate areas, all worked up. Now we see. But it would have made zero sense to me that this profound area, hit in both price and time dead on, would not produce any reaction. Now all is as it should be.
JI
jimkane
Rep: 3,058
Posts: 33,089
Here's a great example of 'context'. This is a nice setup, but it's up against the monster setup at 40-42, and so if that is to play out, this setup should give way. If it produces any more than a tiny KZ reaction, that would imply that 40-42 area is not as critical as I suspect it is.
Originally posted by MarcinO
Let's see it this ABCD is enough to drive the ES below 1640.
The middle of the PTA in my CFD is equivalent to 1657-58 in ES.
Click image for original size
JI
jimkane
Rep: 3,058
Posts: 33,089
Eric,
The blue set is a modified Schiff set off the 8/7 low? Is there a way for eSignal platform to show the line on a set like that from the 8/7 low to the second point, the 8/12 high, so that it is clear it is a modified Schiff set, and where it is anchored?
The blue set is a modified Schiff set off the 8/7 low? Is there a way for eSignal platform to show the line on a set like that from the 8/7 low to the second point, the 8/12 high, so that it is clear it is a modified Schiff set, and where it is anchored?
Originally posted by EricD
great Gold Chart Marcin......Kane Traders all over it...
Click image for original size
Click image for original size
JI
jimkane
Rep: 3,058
Posts: 33,089
I have two levels here as this begins to struggle a bit.
57.50-58.50
64.00-65.00
These are 'center of areas', of course.
Interestingly, the .300 is at 61, and something else comes in there, so I will keep an eye on that. otherwise, it's not really an area. I am a bit surprised it isn't stronger that it is, and that is curious to me. I can't imagine they won't push it to at least the KZ (.382 at 66.25, .447 at 70.25, rounded), which at the upper part is getting in the area of the breakdown, depending on how one draws that. It makes no sense to me that they wouldn't push it there. The only reason would be profound weakness, but everyone is calling for more downside, so that makes no sense to me...
JI
jimkane
Rep: 3,058
Posts: 33,089
Alright, I'll finish with a little visual. Make sure you look at all the posts and the timestamps. Look on a 1-min. This chart is just a guide for what I was saying. Look at it all. They do this all the time, but especially on a Friday when it sets up like this and is dead at the times of day this was.
Chart created on QCharts, courtesy eSignal
Click image for original size
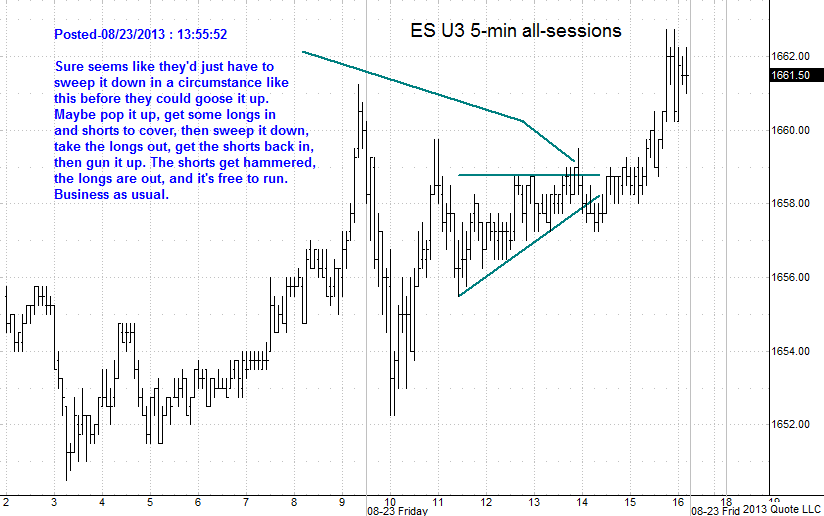
Chart created on QCharts, courtesy eSignal