ES Wednesday 10-9-13
I really enjoyed making this one today....I hope it gives some ideas of how the daily bar charts can help us...
key zone above is 57.50 - 59.50
below is 50.50 - 51.25
those are upper and lower bell extremes
watch the video if/when you have time....
key zone above is 57.50 - 59.50
below is 50.50 - 51.25
those are upper and lower bell extremes
watch the video if/when you have time....
all done on that test of yest rth low...basically in same neighborhood as vpoc
those triples at 47.5 gave me some confidence we were gonna get to that zone !
those triples at 47.5 gave me some confidence we were gonna get to that zone !
very cool Nick !!
ok, here is the chart i promised
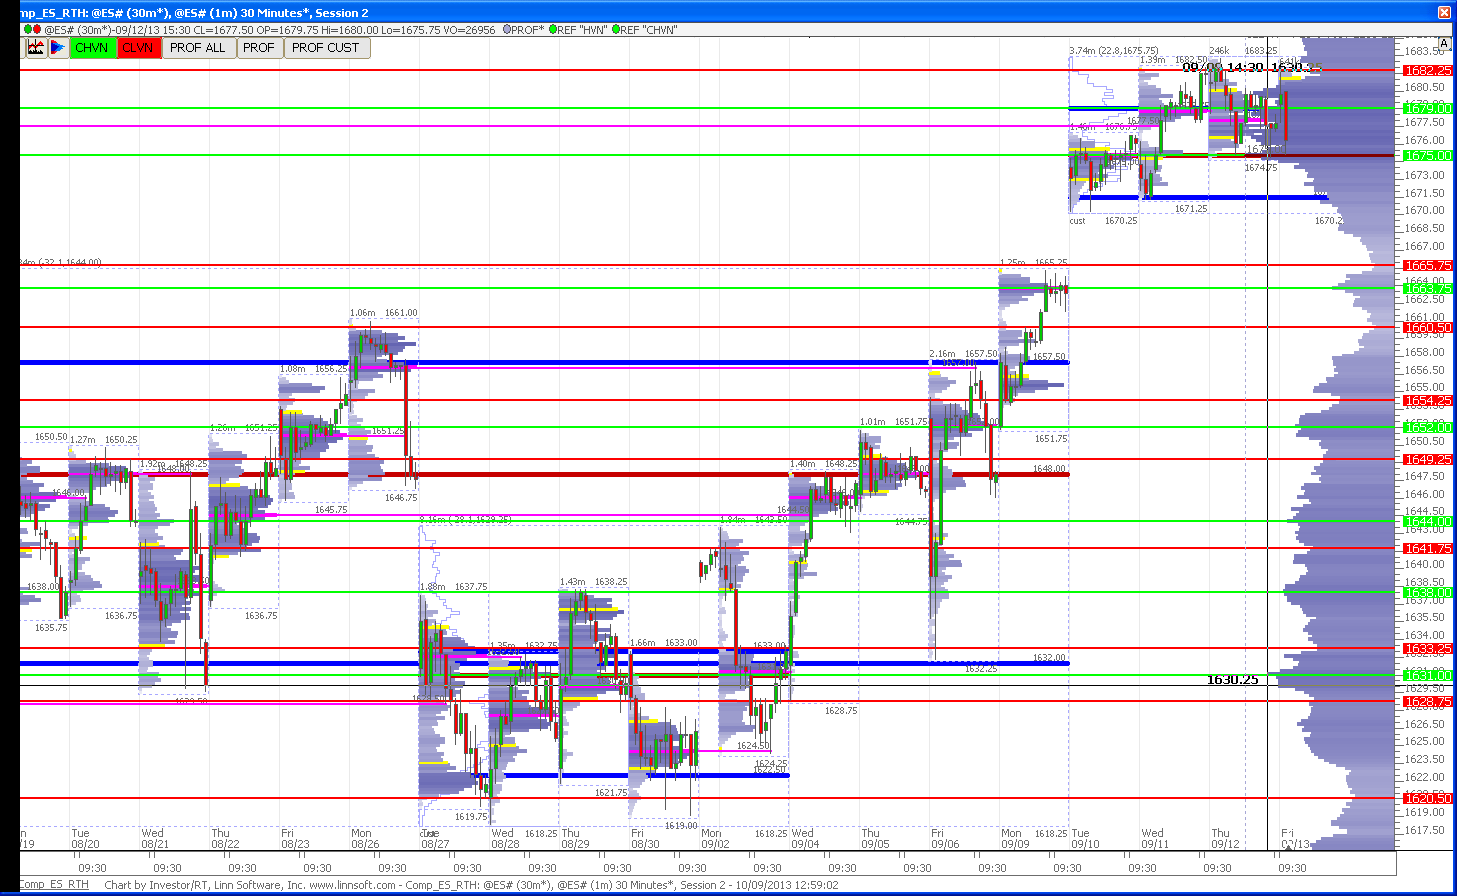
u can see from 9/6 that 40.5 was the peak of the lower bell from that day, and u can see that green line on the 1638 level reflecting a hvn from the composite chart (right hand side)...so net net u had a nice bell from 9/6 and below u had support at 38 from the composite chart, hence the 38-40.5 zone
the reason why i tried the top of the zone was that we had s1 at 40.5 (using 24 hr data) and 2x ib at 40.25 so very nice confluence there...i would have added down at 38 had it gone there directly
Click image for original size
anybody selling this 1654.50 zone?
Originally posted by stocksster
Originally posted by BruceM
.....magnet still at 53.75 - 54.75
onvpoc has not been tagged yet.
there goes the onvpoc...finally.
that's a hell of a way to get the vpoc....yikes...not me koolio...prefer to sell up into 57.50 - 59.50.....I try to stay out of the center but hope it sells off hard for you
great Nick...hey, I can vote now.......seems to be working for me ..
i did kool...but yeah, fact that is the middle of that bell curve (in fact 54.5-56 is) makes me a bit nervous...so pretty tigh stop on this for me
taking half off at 1662.50...the 54.50 was the 2.618 projection from 1640 to 1645.50 initial move
im no hero ..im out at 1651 on my 2 runners (if i get lucky!)... breakeven 54.50 stops my runners
whats always interesting is that so many of us have read that a failed auction on one side of a range ( a bell curve) can often go push to the other side....what the books etc never tell us is that there is no time limit on these failures and often we will see a bell curve get entered back into at some later date.....these failures happen on so many different time frames but for me it's watching those edges from different days to see if we are going re-take them and hold or reject them...
the point is that so far today is a good lesson that we can reverse roles quite often at the bell curve edges...also usually know as LVN's on different time frames
now all this babble would really have made me feel better if I had bought one of those retest into the lower edge I mentioned on the video after they rejected that prominient POC/vpoc at 54.75.....ok, so ends todays after the fact ramble
Emini Day Trading /
Daily Notes /
Forecast /
Economic Events /
Search /
Terms and Conditions /
Disclaimer /
Books /
Online Books /
Site Map /
Contact /
Privacy Policy /
Links /
About /
Day Trading Forum /
Investment Calculators /
Pivot Point Calculator /
Market Profile Generator /
Fibonacci Calculator /
Mailing List /
Advertise Here /
Articles /
Financial Terms /
Brokers /
Software /
Holidays /
Stock Split Calendar /
Mortgage Calculator /
Donate
Copyright © 2004-2023, MyPivots. All rights reserved.
Copyright © 2004-2023, MyPivots. All rights reserved.