Ruminations on the ES longer term
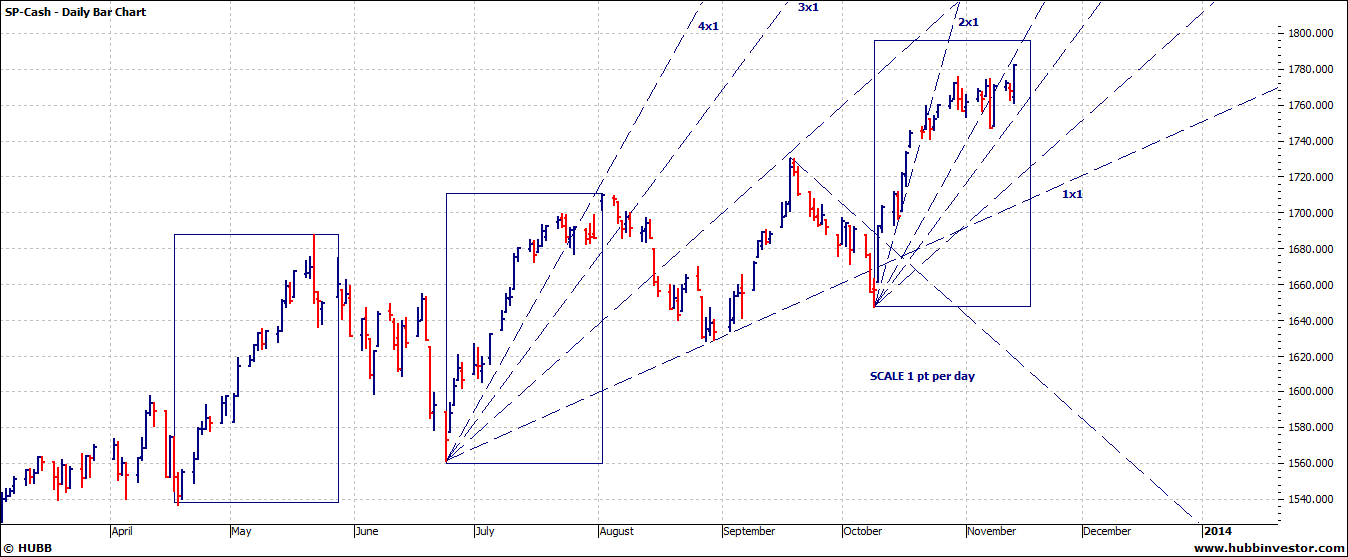
Well, its been a hell of a run since Mar 09 PT ,VO, Charter Joe, and many others were trading those crazy days with there crazy 50 point swings in the ES, both up and down. Recent wild action with its 32 handle ranges pales, but is certainly reminicient. The purpose of this post is not a forecast, but a discussion of why there is such erratic behavior , and why its important. Fundementalists would point to QE3 and its inevitiable end as the cause for concern. Wave theorists generally have targets in this 1780 area. Here is a recent chart from Anthony Caldero that i find interesting...
Click image for original size
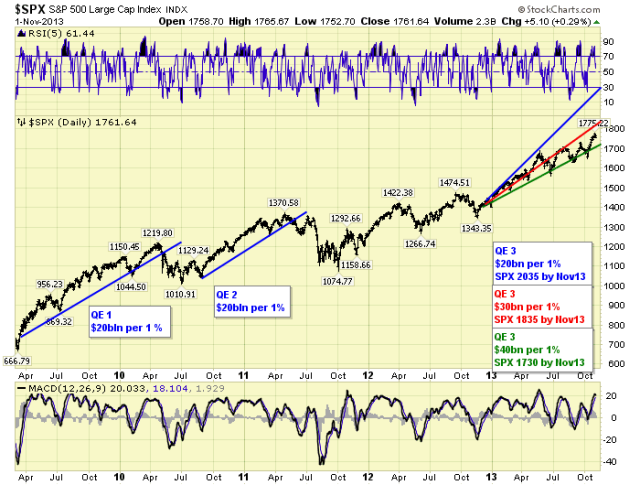
... youve seen all the headlines.. each QE getting less and less bang for the buck. In a nutshell, without trying to guess what wave were in , this has to be the main question..Click image for original size
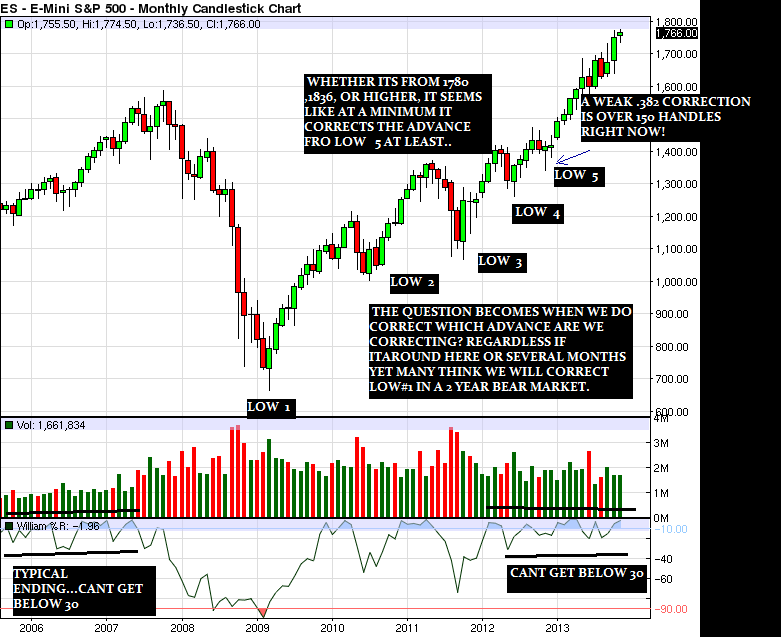
. My own opinion is a high soon, a hundred point plus decline, then advance a few months to the final high before "the big one". (anywhere from April to late 2014 )., then a bear market lasting 2 years into 2016 (not coincidentially an election year. That would usher in a giant wave 3 lasting years..who knows but its fun to speculate... and its imortant if you have a 401k!
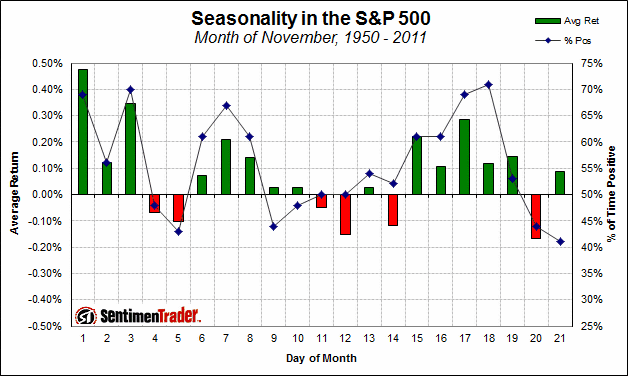
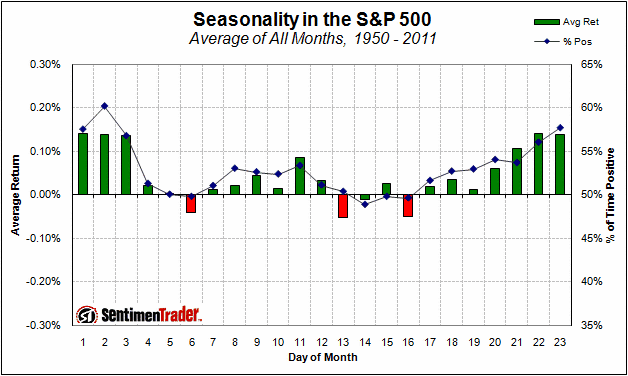
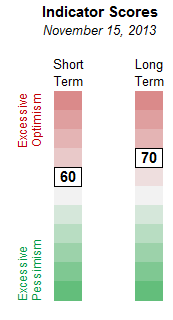
Hopefully newer traders/investors can see why from now and these prices, to next year sometime, and higher prices, nothing lasts forever....in the meantime dont fight the Fed! lol heres some charts courtesy of sentimentrader that are fun...
Click image for original size
Click image for original size
Click image for original size
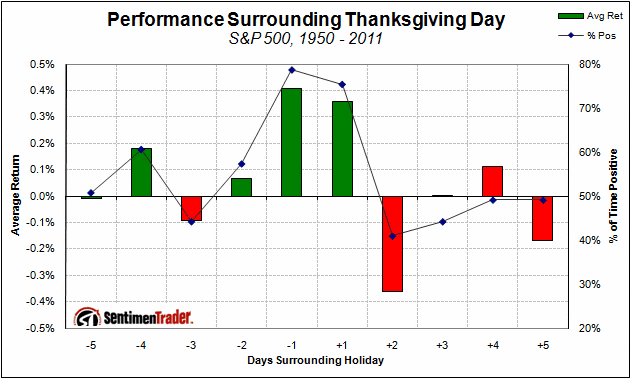
Click image for original size
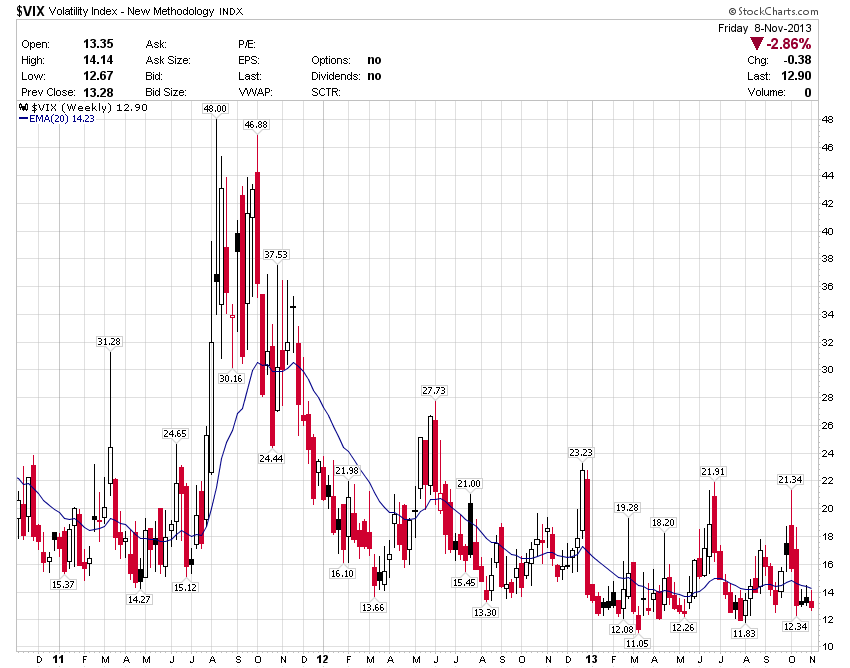
I recall the day the S&P touched 666, looking back I guess that was once in a lifetime volatility.
Here is a weekly chart of the volatility index with 20 week average volatility at 14 the volatility crush continues (for now)
Here is a weekly chart of the volatility index with 20 week average volatility at 14 the volatility crush continues (for now)
Click image for original size

Fasten your seatbelt's, the fun is just getting started
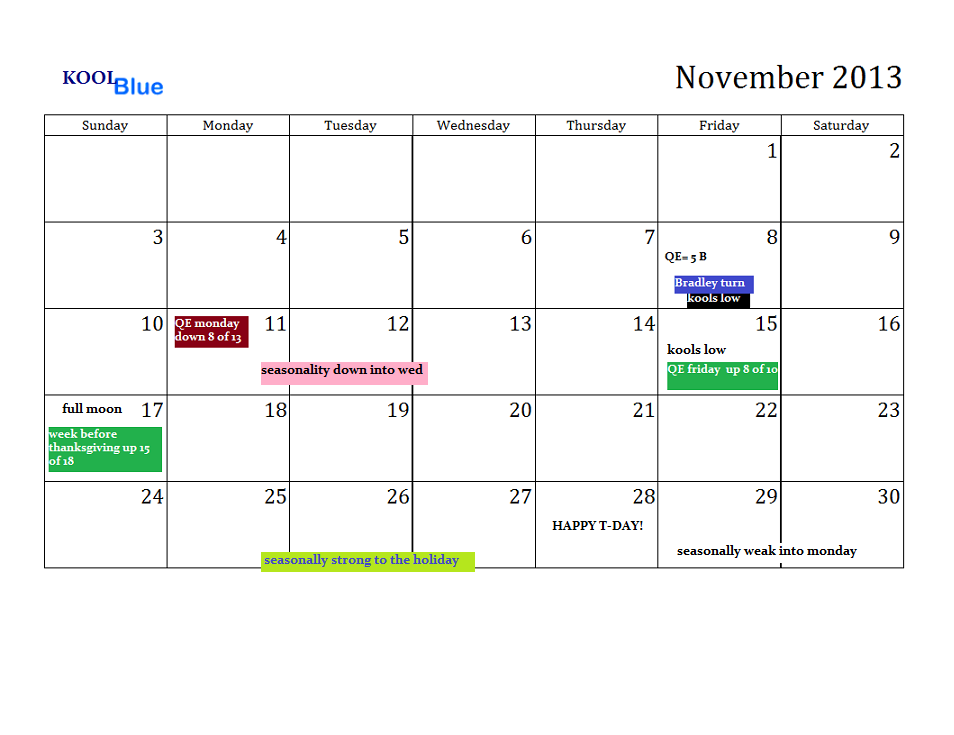
Kool,
Somehow I could not line up your calendar with the Nov S&P500 seasonal data.
Somehow I could not line up your calendar with the Nov S&P500 seasonal data.
Remember, seasonals are a tendency , not an absoulute!.. i use the line ,which shows a little peak on day 7 (not the 7th.. remember this goes by trading days,i.e. monday the 11th was the 7th trading day of the month!) to the 9th trading day of the month (wed the 13th).. hope this helps.
Click image for original size

Click image for original size
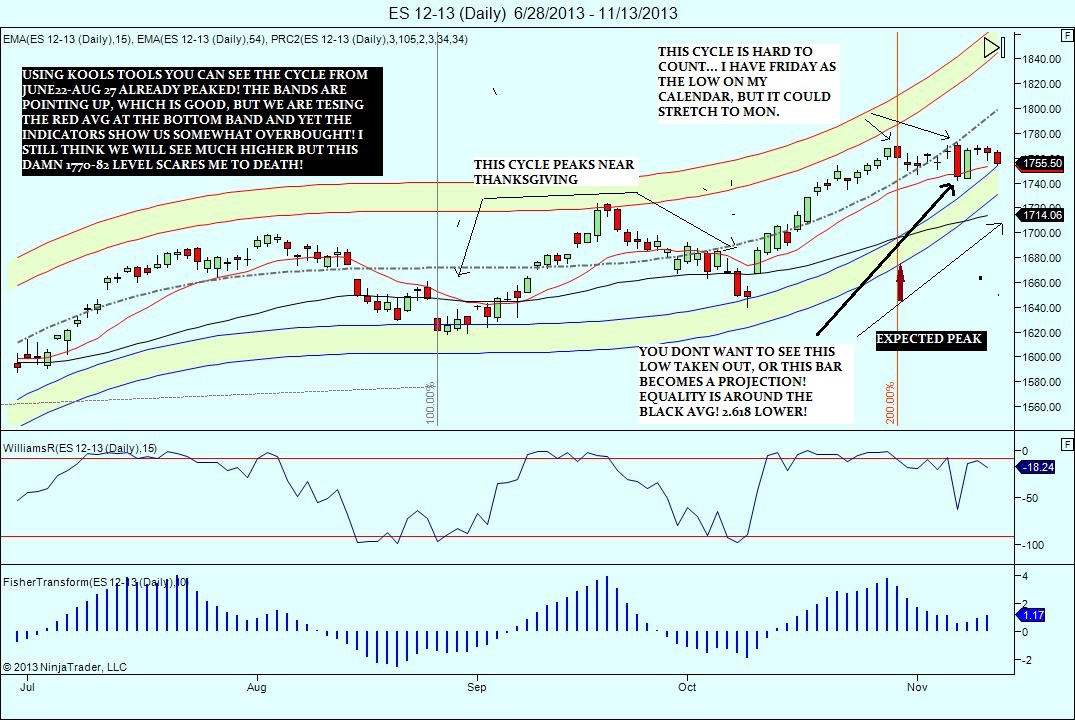
The yearly R4 pivot point is at 1818.
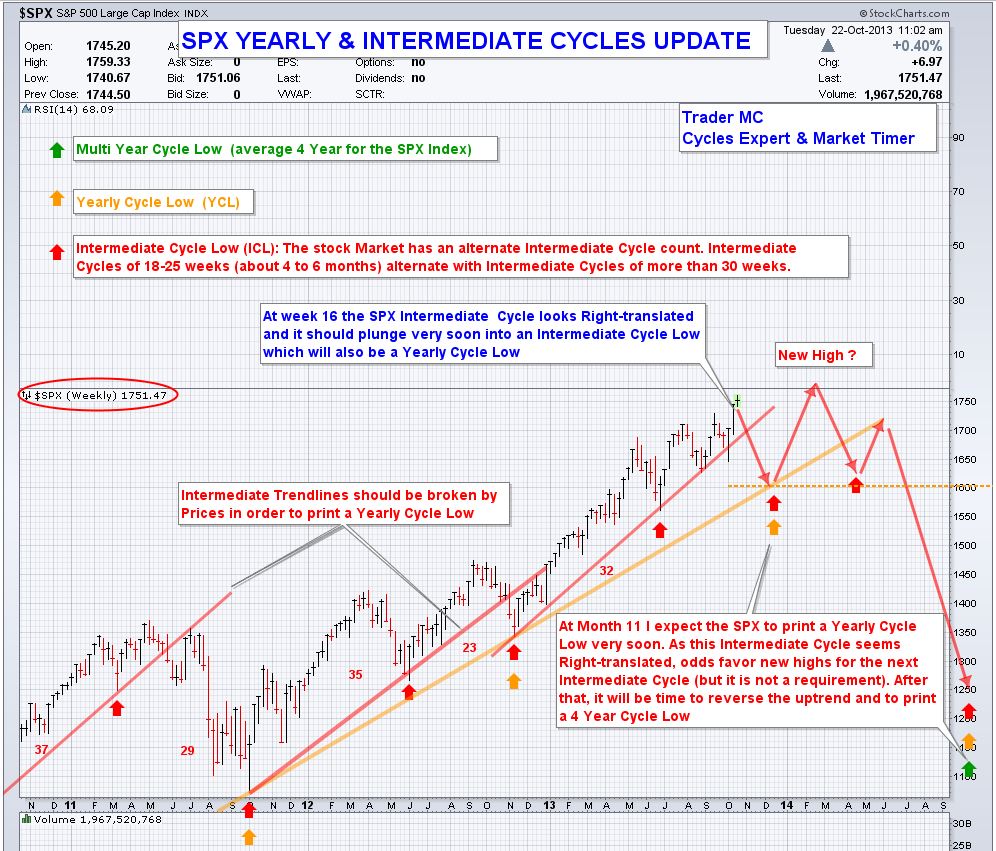
Heres an interesting chart i came across while surfing the web!
Click image for original size
Click image for original size
Click image for original size
Click image for original size

Emini Day Trading /
Daily Notes /
Forecast /
Economic Events /
Search /
Terms and Conditions /
Disclaimer /
Books /
Online Books /
Site Map /
Contact /
Privacy Policy /
Links /
About /
Day Trading Forum /
Investment Calculators /
Pivot Point Calculator /
Market Profile Generator /
Fibonacci Calculator /
Mailing List /
Advertise Here /
Articles /
Financial Terms /
Brokers /
Software /
Holidays /
Stock Split Calendar /
Mortgage Calculator /
Donate
Copyright © 2004-2023, MyPivots. All rights reserved.
Copyright © 2004-2023, MyPivots. All rights reserved.