JI
jimkane
Rep: 3,058
Posts: 33,089
Just starting it off. I wonder if they'll keep doing late day rapid-sells, or was that just a holiday week anomaly?
JI
jimkane
Rep: 3,058
Posts: 33,089
I just can't see it, but you never know. It's acting done. Nobody should (ever) act on my posts and reads, though, I'm just talking out loud.
JI
jimkane
Rep: 3,058
Posts: 33,089
What's amazing is how the bounce started at a line from the set I used for the previous bounce, and it bounced right back up to the previous line. Just incredible.
JI
jimkane
Rep: 3,058
Posts: 33,089
Now we see (well, now being at some point from here) if this is an ABCD, or if this is a 'W3' and down more we go.
JI
jimkane
Rep: 3,058
Posts: 33,089
What I find curious today is how they are selling bonds. Look at JNK and MUB, for example, and TLT for treasuries. The market is down, so shouldn't bonds be getting the flow? Gold and silver are down, again, where's the money going? The yen is dumping even more, so that means carry trade and risk assets up, right? Yet EWJ is down, our market is down, bonds are down, PM's are down. Only crude is up, but not tremendously. Very odd, to me.
RA
rat89
Rep: 0
Posts: 7,015
that's what I was wondering.
Originally posted by jimkane
What I find curious today is how they are selling bonds. Look at JNK and MUB, for example, and TLT for treasuries. The market is down, so shouldn't bonds be getting the flow? Gold and silver are down, again, where's the money going? The yen is dumping even more, so that means carry trade and risk assets up, right? Yet EWJ is down, our market is down, bonds are down, PM's are down. Only crude is up, but not tremendously. Very odd, to me.
JI
jimkane
Rep: 3,058
Posts: 33,089
One thing still predominates the blogs and such. 1,000% bullish. The talk is this is the start of a new secular bull. Hence, it should go up for way over a decade now. Seriously. They say the cycle is 13-15 years, and since the secular bear started in 2000, it's likely over now. Here's a few things that don't add up to me. One, the cycle averages 17.2 years from everything I have seen, so 2017, not 2013. Next, does the new cycle start after nearly five years of straight up? This is in there with the five longest running cyclical bulls in history, and four of those others ended with huge crashes.
But, the secular bull starts after five straight years of up, and then goes up for 13-15 years from there? That's what history shows? Didn't the secular bear end in 2009, then? Who would say the secular bear was in full swing from 2009 - 2014, then the secular bear ended and the secular bull started? What? If this followed a reasonable cycle, it would have a cyclical bear now, then a secular bull could start. Even that makes little sense, because the cyclical bear may last a year or less, then it's late 2014 or early 2015, and that doesn't jibe well with 2017.
Regardless, pretty much everyone is bullish; wildly bullish. They all say it can't be a top because everyone is calling for a top. Other than the usual perma-bears, I see no one calling for a top. Every last person I see is not only talking up, way up, they are talking monster up, for years. Or should I say years and years (and years). It can be maddening to see these morons be right over and over, but I can't ignore my own studies because they are all insanely, wildly bullish no matter what. I still can't reconcile how this is going to go down when they increase QE soon, but bubbles have their own mathematical dynamic, and once the threshold is exceeded, no amount of money printing shy of a Zimbabwe hyperinflation will stop it from going down (recall during their hyperinflation their stock market was the best performing, by far, in the world, on a nominal basis).
On the other hand, in The Bizarro World all those suckers with zero skill will likely be right, and someone like myself, with a gifted mind and about 45,000 hours of hard work into the game, I'll be completely off base, as this rises and rises and rises. That's the very definition of 'The Bizarro World'.
JI
jimkane
Rep: 3,058
Posts: 33,089
ES looks ready to continue this move off the area. No surprise there.
JI
jimkane
Rep: 3,058
Posts: 33,089
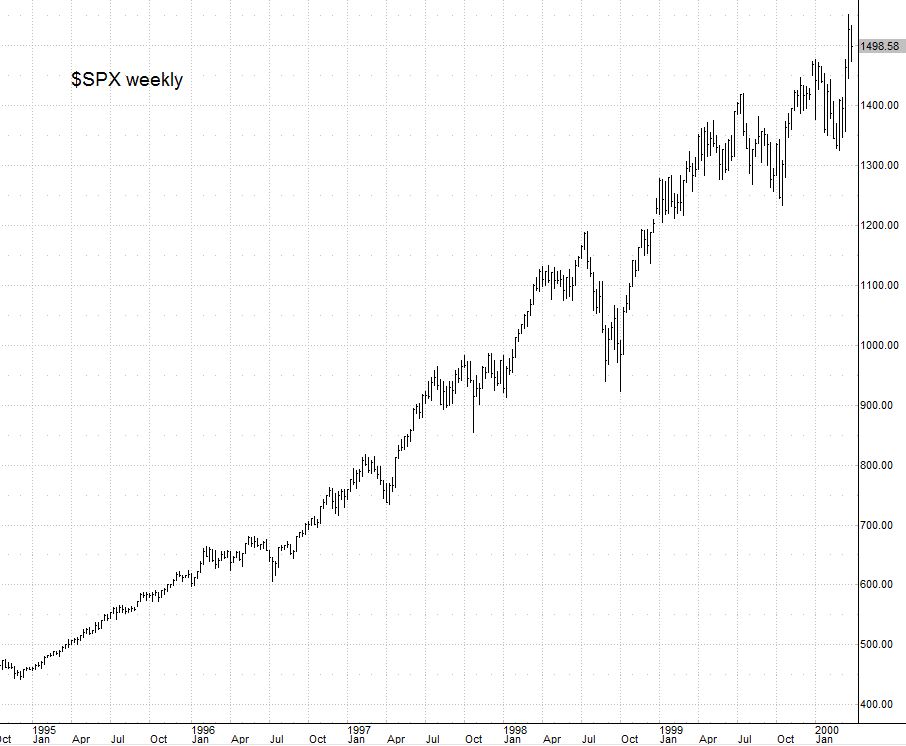
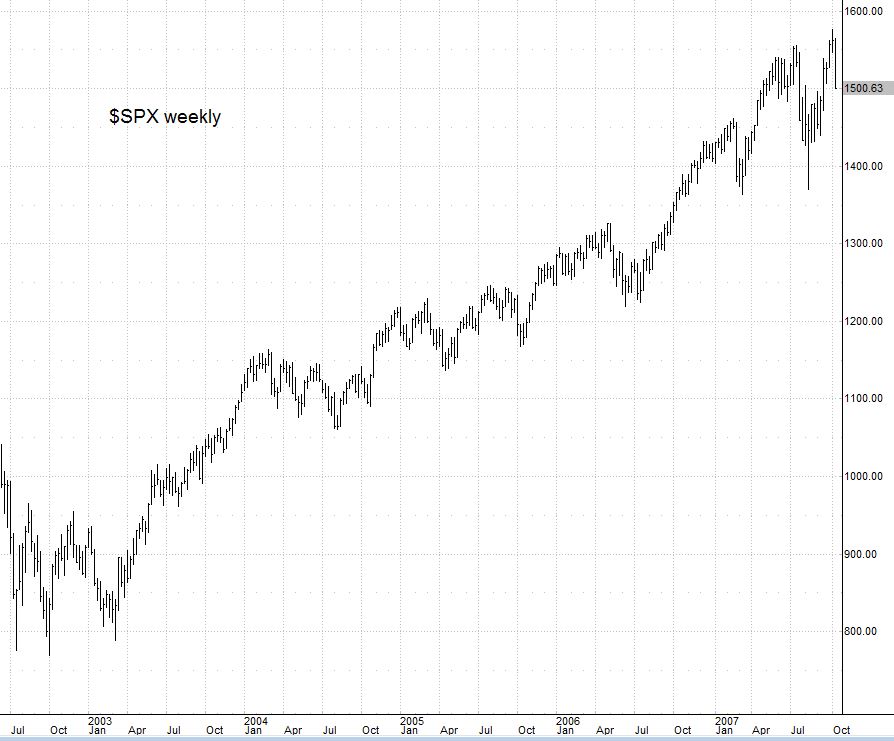
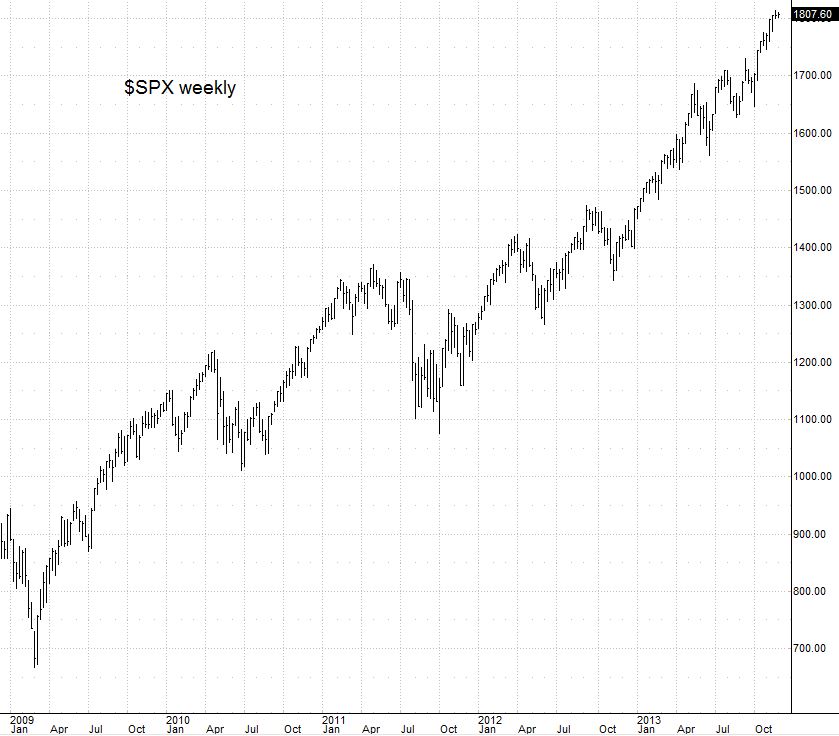
Here's a post to dispel just some of the utter nonsense I hear out there. All this talk by the bulltards about why this can't be the area of a top, or anywhere near the top. They talk real well, but they tend to be short on technicals. Here's one of the main things I keep hearing, over and over and over, until I'm blue in the face. Let's assess this together. 'They' keep saying there is no way we are anywhere near a top, because it must, absolutely must, do a blow off move. All bulls end with a blow off move. They do? I never noticed that. Let's look at the last two bulls, and the current 'bull', on the weekly $SPX.
Here's 2000, showing the top bar:
Here's 2007, showing the top bar:
And here's the current situation:
Now, first off, did the last two bulls end with blow off moves? If so, I can't see them. They went up in a steady trend, and then ended. Now look again at the current 'bull'. If anything, that is the outlier as far as being overextended. If I look at the three charts, not knowing what they were or the timeframe, I'd think the last chart is the most likely to dump hard. Declining pullback size, very extended last wave, and a 3D 'throw over' move. Looks done to me. Regardless, I can't see the substantiation to the endless claims that this can't be near done because there is no blow off, climax move. I guess all these bloggers, pundits, and wannabe traders don't actually look at any charts over a 5-min timeframe...
Charts created on QCharts, courtesy eSignal
Here's 2000, showing the top bar:
Click image for original size
Here's 2007, showing the top bar:
Click image for original size
And here's the current situation:
Click image for original size
Now, first off, did the last two bulls end with blow off moves? If so, I can't see them. They went up in a steady trend, and then ended. Now look again at the current 'bull'. If anything, that is the outlier as far as being overextended. If I look at the three charts, not knowing what they were or the timeframe, I'd think the last chart is the most likely to dump hard. Declining pullback size, very extended last wave, and a 3D 'throw over' move. Looks done to me. Regardless, I can't see the substantiation to the endless claims that this can't be near done because there is no blow off, climax move. I guess all these bloggers, pundits, and wannabe traders don't actually look at any charts over a 5-min timeframe...
Charts created on QCharts, courtesy eSignal