ES Tuesday 12-3-13
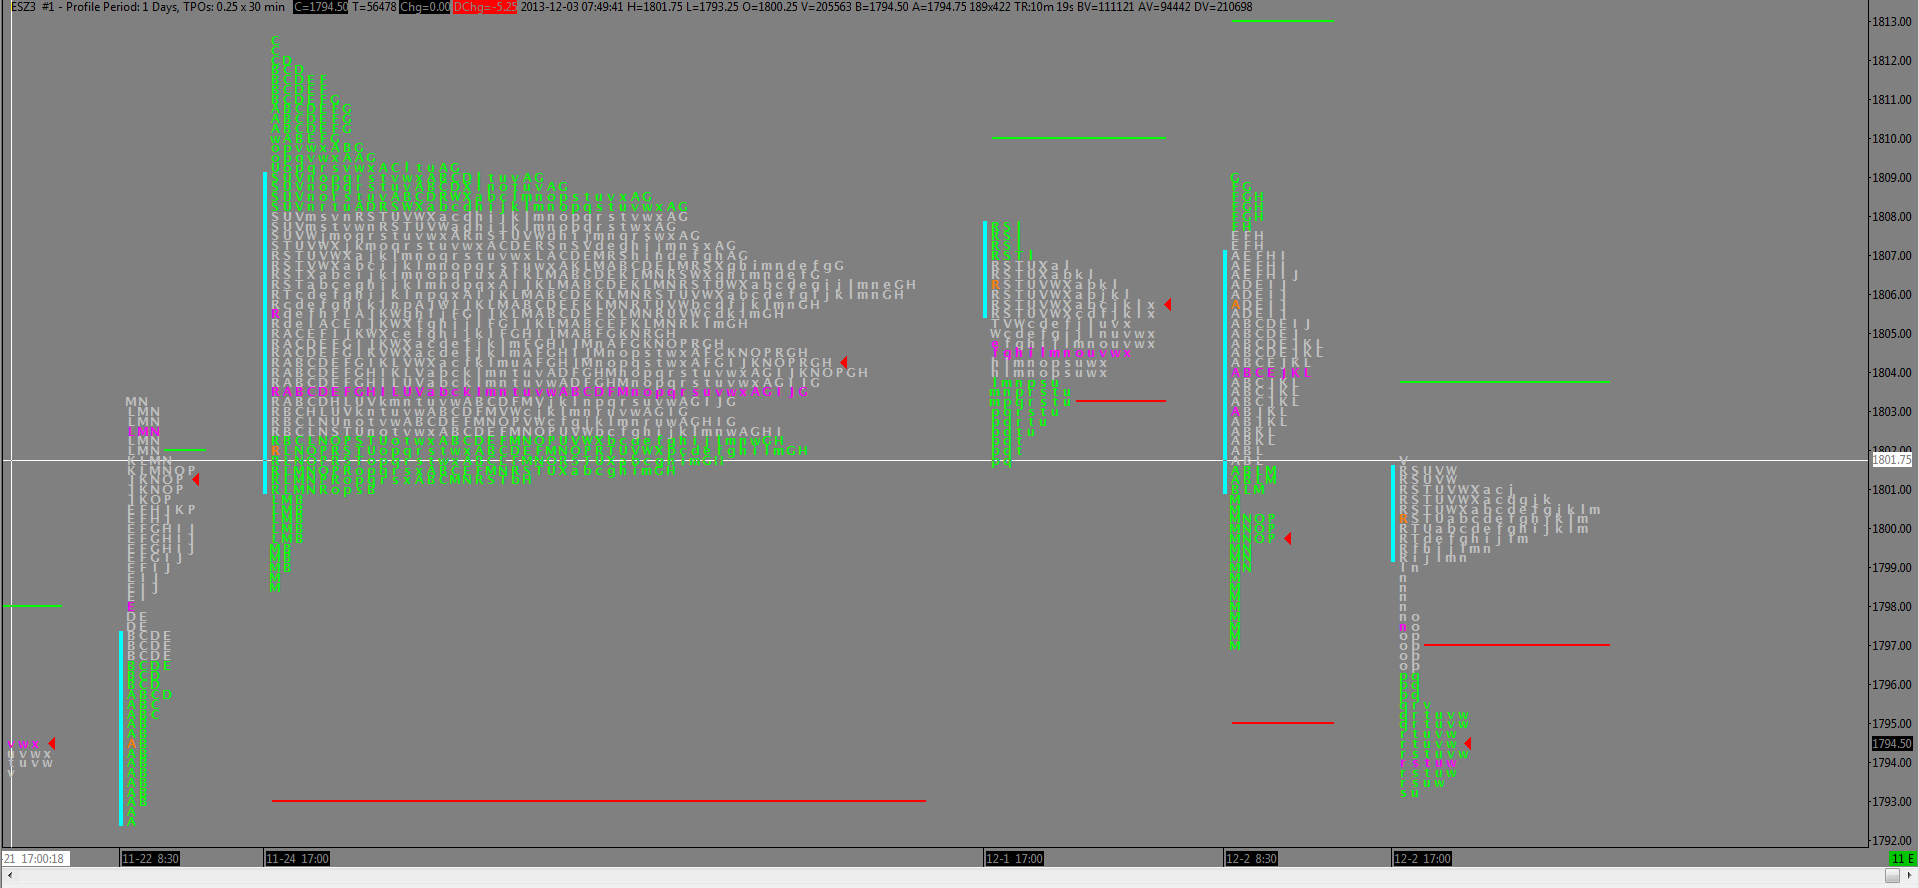
Attached is the same profile from yesterday showing last week as a combined balance area. To the right you have the Sun/Mon overnight and then Monday's session showing balance until late in the session when it sold off below that critical 0100 number. Then we have the current overnight showing continuation below the 0100 area.
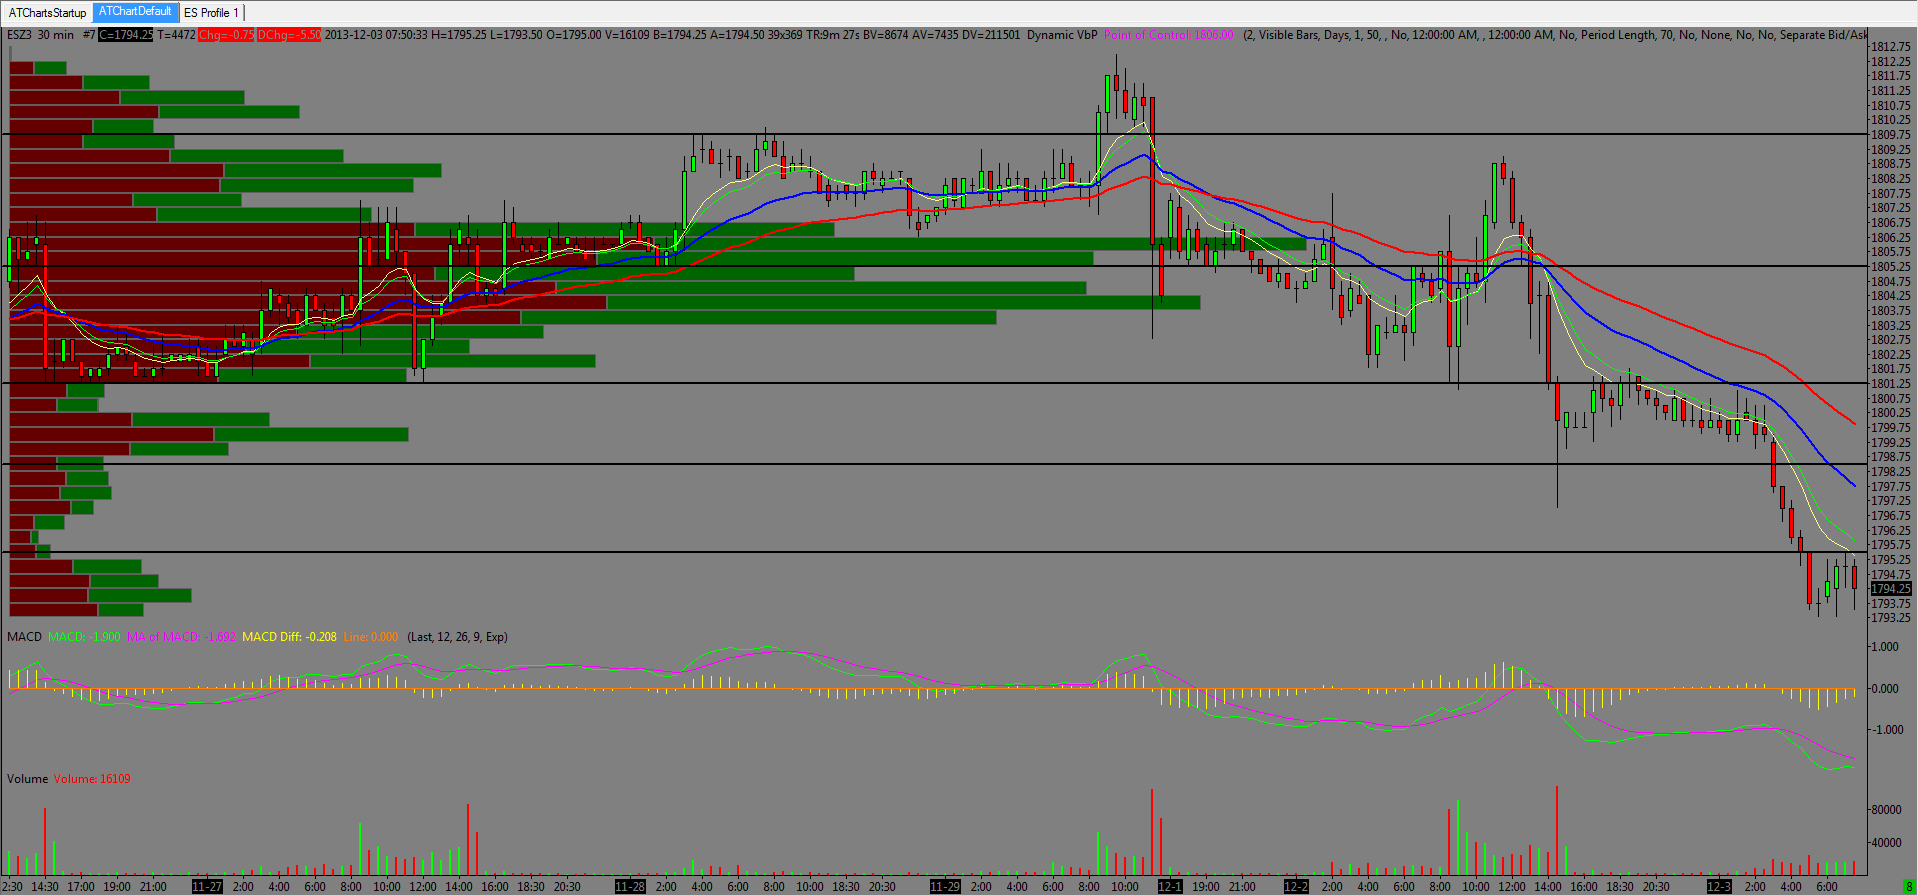
Then we have the current 30 minute which show the breakdown overnight. The lines snapped at 9850 and 9550 were LVMs from earlier in November. We went right thru both and now the 9550 acts as resistance.
Did we get too short overnight? Dunno.
Below this I have the NVPOC at 90.75 and an 8850 LVM. That 92-9250 area was also a key number.
Click image for original size
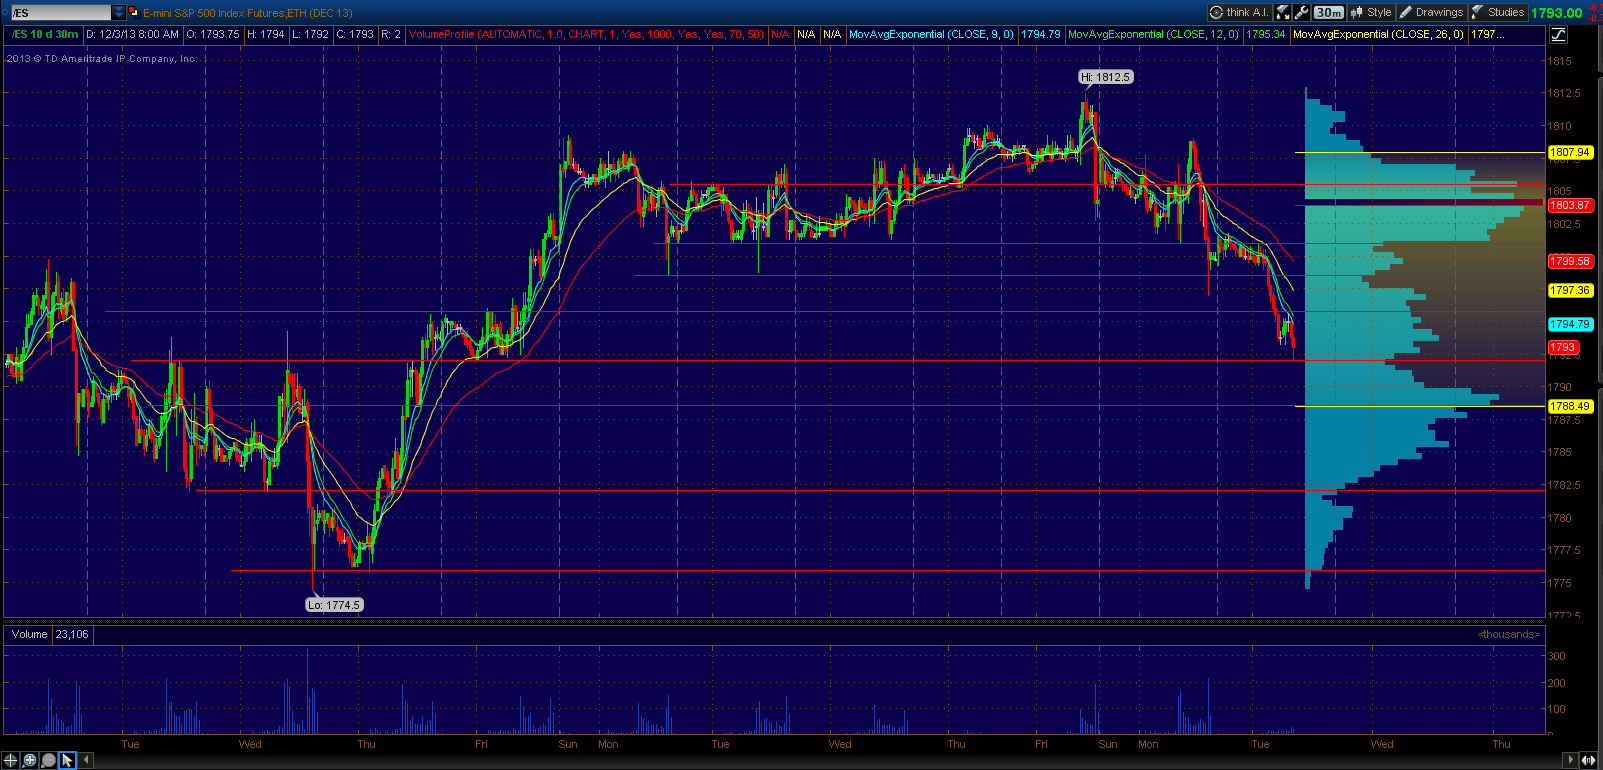
Here is an alternative view of the 30 minute showing where I marked those levels. The scale is a little hard to read but you can see the 9850 level from the LVM and those two tails early last week. Then the 9550 as an LVM and pretty much the late week highs of the week prior. Also that 9250 LVM and where we are currently stopped in the pre market.
Click image for original size
See also Kool,Blue's weekly synopsis from last night. Real good Stuff
Love that chart you posted at 9:16 Bkay.. I voted you up!
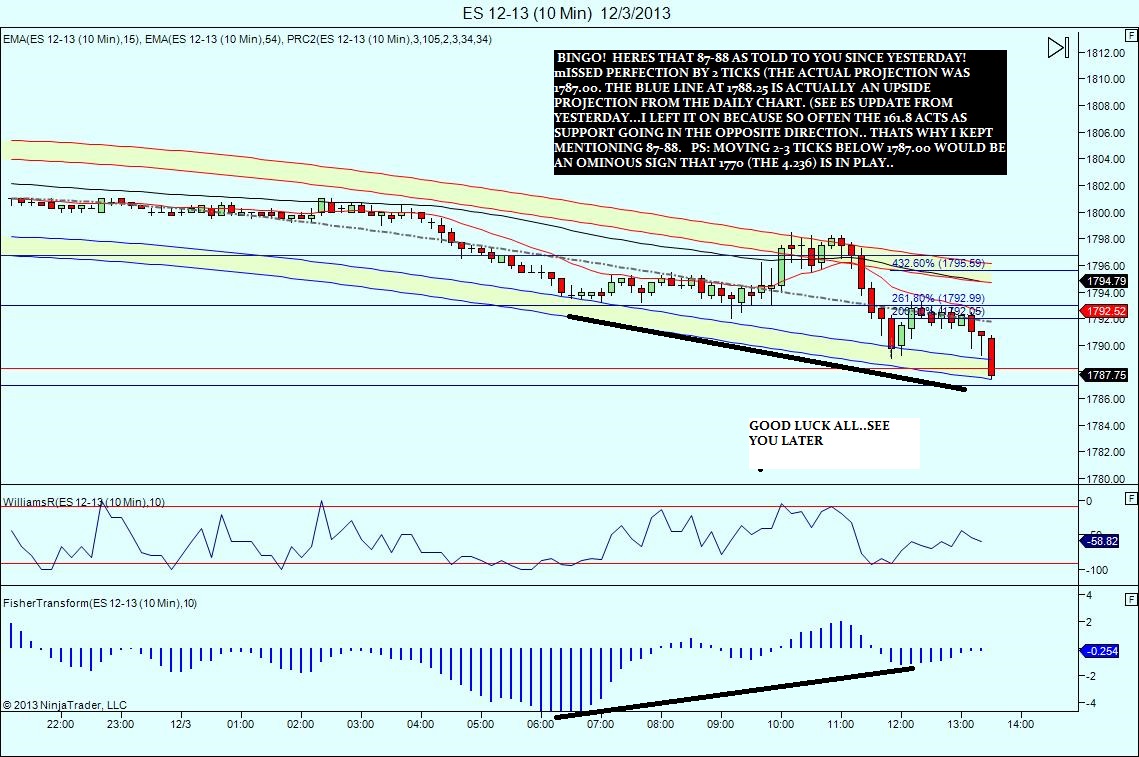
missed that great short at the 1796 number, but i wont miss the 1797 if they go there...
Click image for original size
Originally posted by koolblueThanks
Love that chart you posted at 9:16 Bkay.. I voted you up!
Well that 9850 level they blew through O/N got tested
Pretty good call on that 93 bounce Kool
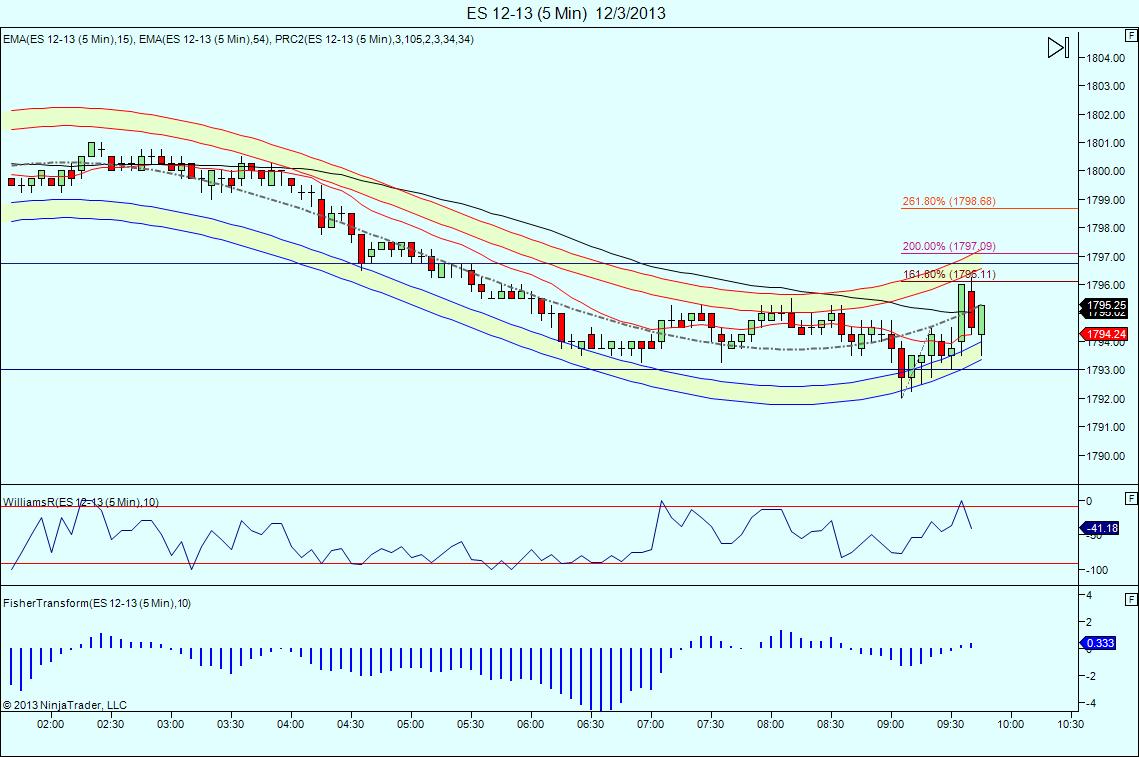
thx..of course im now short..sold one at 1797.00 and one at the 261.8 at 1798.50...now i dont want to see us hang above 1796 for long (at least an hour or so) or the 30 and 60 min charts could become positive
I know the seasonals are positive today and into tomorrow, i have to be careful here.. my goal as always is at least 2 handles ( 1795.50) which is right where the red avg on the important 10 min chart is. we hit it and i got no fill, so i took one off at 1796.00. holding the other with a 1.5 handle stop (1799.00) for much lower....the reason im shorting instead of my usual buying is the negative moving avg cross on the 30 min and especially the hourly chart... it happens so infrequently that its usually a good move eventually...
Kinda ping-ponging between these two levels 9850-9550, let's see which one breaks.
Click image for original size
...
Emini Day Trading /
Daily Notes /
Forecast /
Economic Events /
Search /
Terms and Conditions /
Disclaimer /
Books /
Online Books /
Site Map /
Contact /
Privacy Policy /
Links /
About /
Day Trading Forum /
Investment Calculators /
Pivot Point Calculator /
Market Profile Generator /
Fibonacci Calculator /
Mailing List /
Advertise Here /
Articles /
Financial Terms /
Brokers /
Software /
Holidays /
Stock Split Calendar /
Mortgage Calculator /
Donate
Copyright © 2004-2023, MyPivots. All rights reserved.
Copyright © 2004-2023, MyPivots. All rights reserved.