Special holiday update ES 12/24/2013
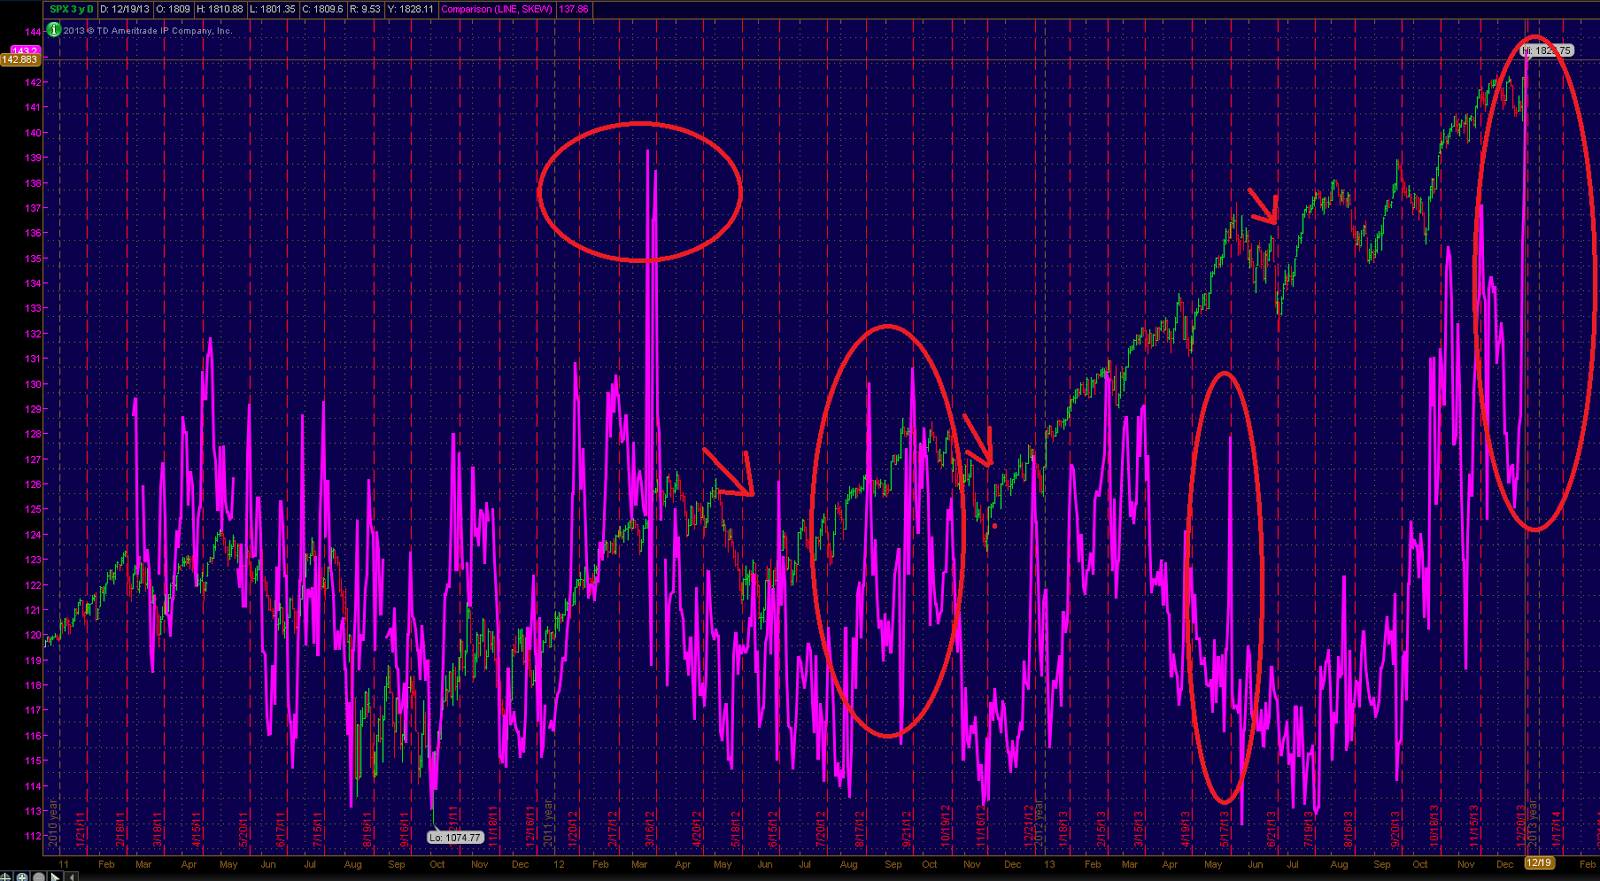
They call it silly season for a reason folks. The period we are now in (generally very bullish) which ends around Jan 2nd or 3rd. For some time i had concerns about the market being due for an intermediate top, or God forbid, a major top! I have shown the weekly chart which, imho, has a dangerous angle of ascent, and mentioned that the naz is definitely in a parabolic rise..I have indicated the ' best' time frame for this to occur is Jan - Mar 2014. I have showed a long term monthly chart where my own cycle work may indicate a top in Jan 2014. I have warned that we shouldnt get too complacent as we enter the normally bullish 2nd half of Dec period and the likely higher prices that would ensue. Now maybe i will be right and maybe i'll be wrong, but fwiw, my nervousness is shared by some very savvy players in the market...for instance , from J. Hirsch publisher of the stocktraders almanac:" Technical: Toppy. Following early December weakness, DJIA and S&P 500 surged back to fractional new all-time highs. NASDAQ also reached a new post-bubble high. MACD indicators have either just turned positive or are on the verge of doing so. Stochastic and relative strength indicators are neither overbought nor oversold. In the short-term, the path of least resistance remains higher, but the pace of gains has slowed. Over the longer term, the market may be in the process of forming a top." George Lindsay, noted technical analyst, has warned about his 3 peaks and a domed house formation currently under construction with Jan 9 or so as a target for completion. Harmonics analysts have a bearish formation possible from here to around 1870.The CBOE skew index , a measure of risk used by options players, just hit a 52 week high.When SKEW increases, it means tail risk on SPX has increased. Tail risk usually increases when traders have a bad feeling of something coming up ahead, like a crash or a black swan event.
Click image for original size
And from a noted floor trader commenting on the nazdaqs parabolic rise, Sam E." 300 handles outside of standard deviation on nq / yep this is lala land and i cant even explain what these bars are gonna look like when she rolls over / nq late 07 the high we were 1.0687% ouside of standard deviation. we got there today / using nov 07 / we are due 500-700 down / 300 just to slip back inside rising deviation / only once did a monthly candle open and close above all deviations. ever. oct nov 2007 / the fund managers walked away for a year in nov 2007 nq practically became bidless. " Further noting that " if yu shorted the santa rally high dec 26, YOU DID NOT HAVE TO COVER UNTIL MAR 6 2009." Again these comments arn't from some small time daytraders like us ,but from traders in the big spoo pits trading hundreds and in some cases thousands of contracts. They can all be wrong too, but if interpet the above tone of opinions and comments correctly, they remain bullish (as i do for now)but caution for the first quarter of 2014 is in order! Incidentially, they seem to be watching 1829,1836 ,1857 and 1868 basis spx cash. so in summary , dont get too carried away by market rises form here thru mid Jan... nothing lasts forever!
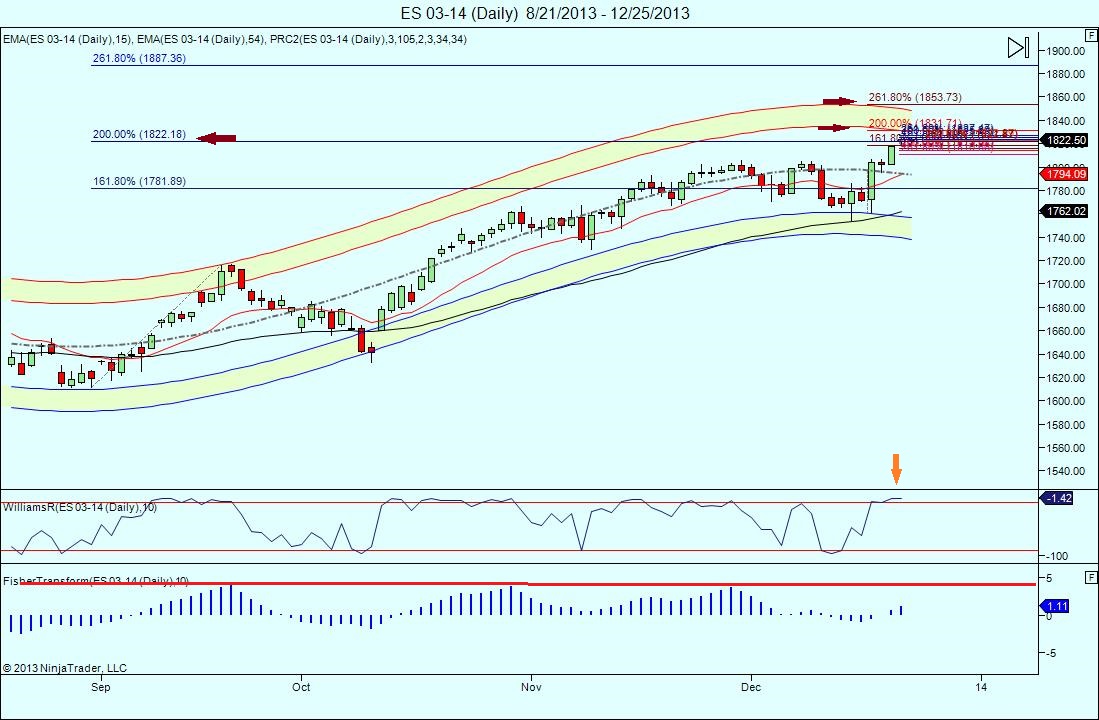
MY own personal numbers im watching for the few days are : 1831.75 , and 1853.75 basis Mar ES contract. On the longer term basis, the daily prc bands remain in a precariously downward tilt, but the avgs have not confirmed yet.. The above mentioned pro's are watching 1799 on the downside (basis cash) and indeed im watching the red avg currently at 1794 and change basis Mar ES. Untill that breaks i remain bullish, but will sell the rallies to my numbers. Have a Merry Christmas all!
Click image for original size
Click image for original size
Click image for original size
And finally, what i want for Christmas!
Click image for original size

Click image for original size

Thanks kool-for all you do. Pictures includedHave a great holiday. It will be fun to see how things play out in the coming weeks/months
Thx, friend... i miss your posts and Nicks and P.T.'S .. Hopefully ,i'll get to see them again after the holidays!
Hope your holiday wishes came true, kool
.
.
Click image for original size
Missed my forecast by one tick! And that chart only got one vote! ...tough room! lol
Thanks for the longer term observations and especially the recognition of the run-up in the NASDAQ in the chart comments at the beginning of the thread.
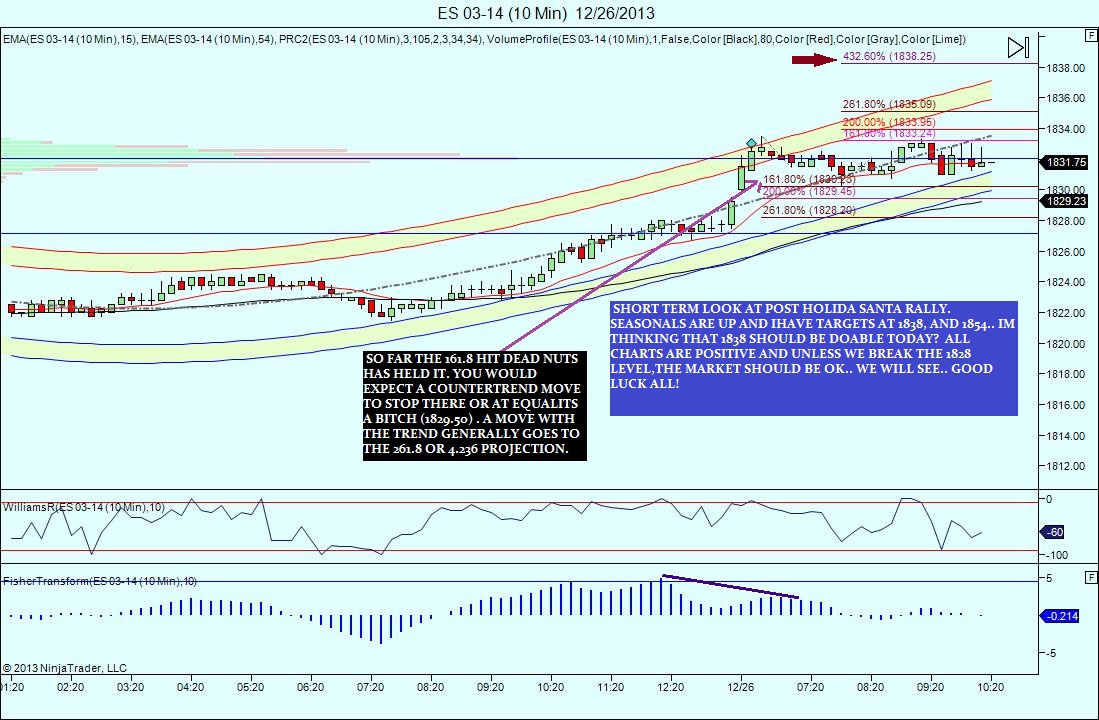
Thx Paul.. today is tougher to gauge than yesterday, but heres a guess...
Click image for original size
Click image for original size

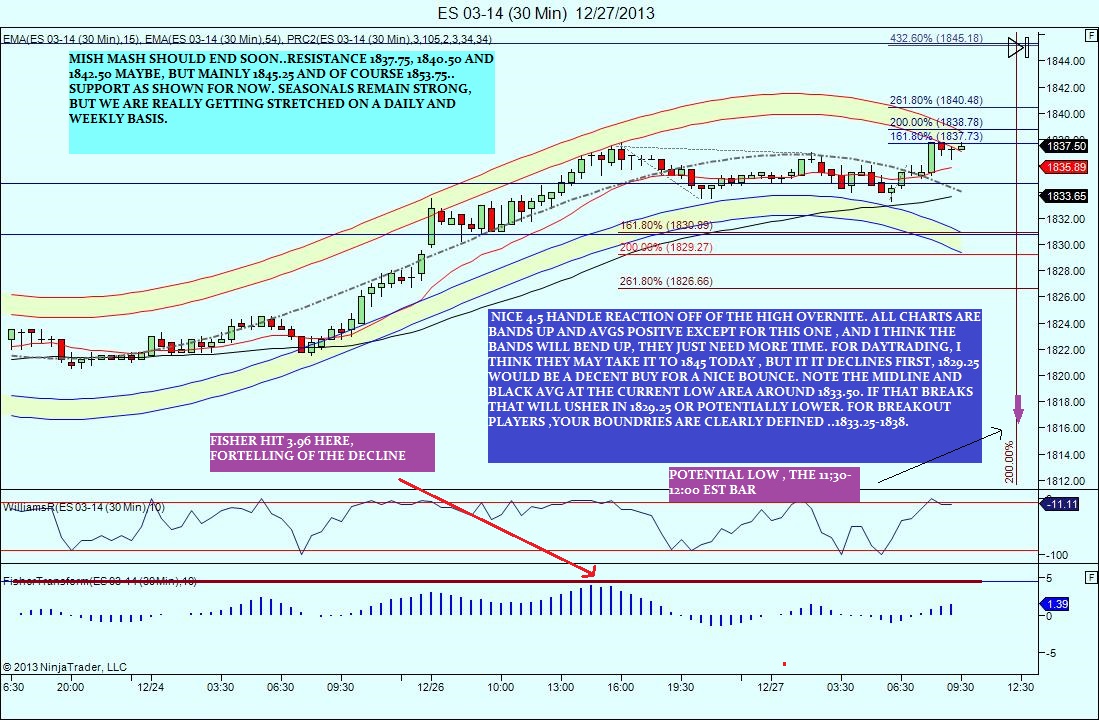
took profits at 1836.50 for 2 handles with 2 contracts... thats it for me.. have a great weekend all!
Emini Day Trading /
Daily Notes /
Forecast /
Economic Events /
Search /
Terms and Conditions /
Disclaimer /
Books /
Online Books /
Site Map /
Contact /
Privacy Policy /
Links /
About /
Day Trading Forum /
Investment Calculators /
Pivot Point Calculator /
Market Profile Generator /
Fibonacci Calculator /
Mailing List /
Advertise Here /
Articles /
Financial Terms /
Brokers /
Software /
Holidays /
Stock Split Calendar /
Mortgage Calculator /
Donate
Copyright © 2004-2023, MyPivots. All rights reserved.
Copyright © 2004-2023, MyPivots. All rights reserved.