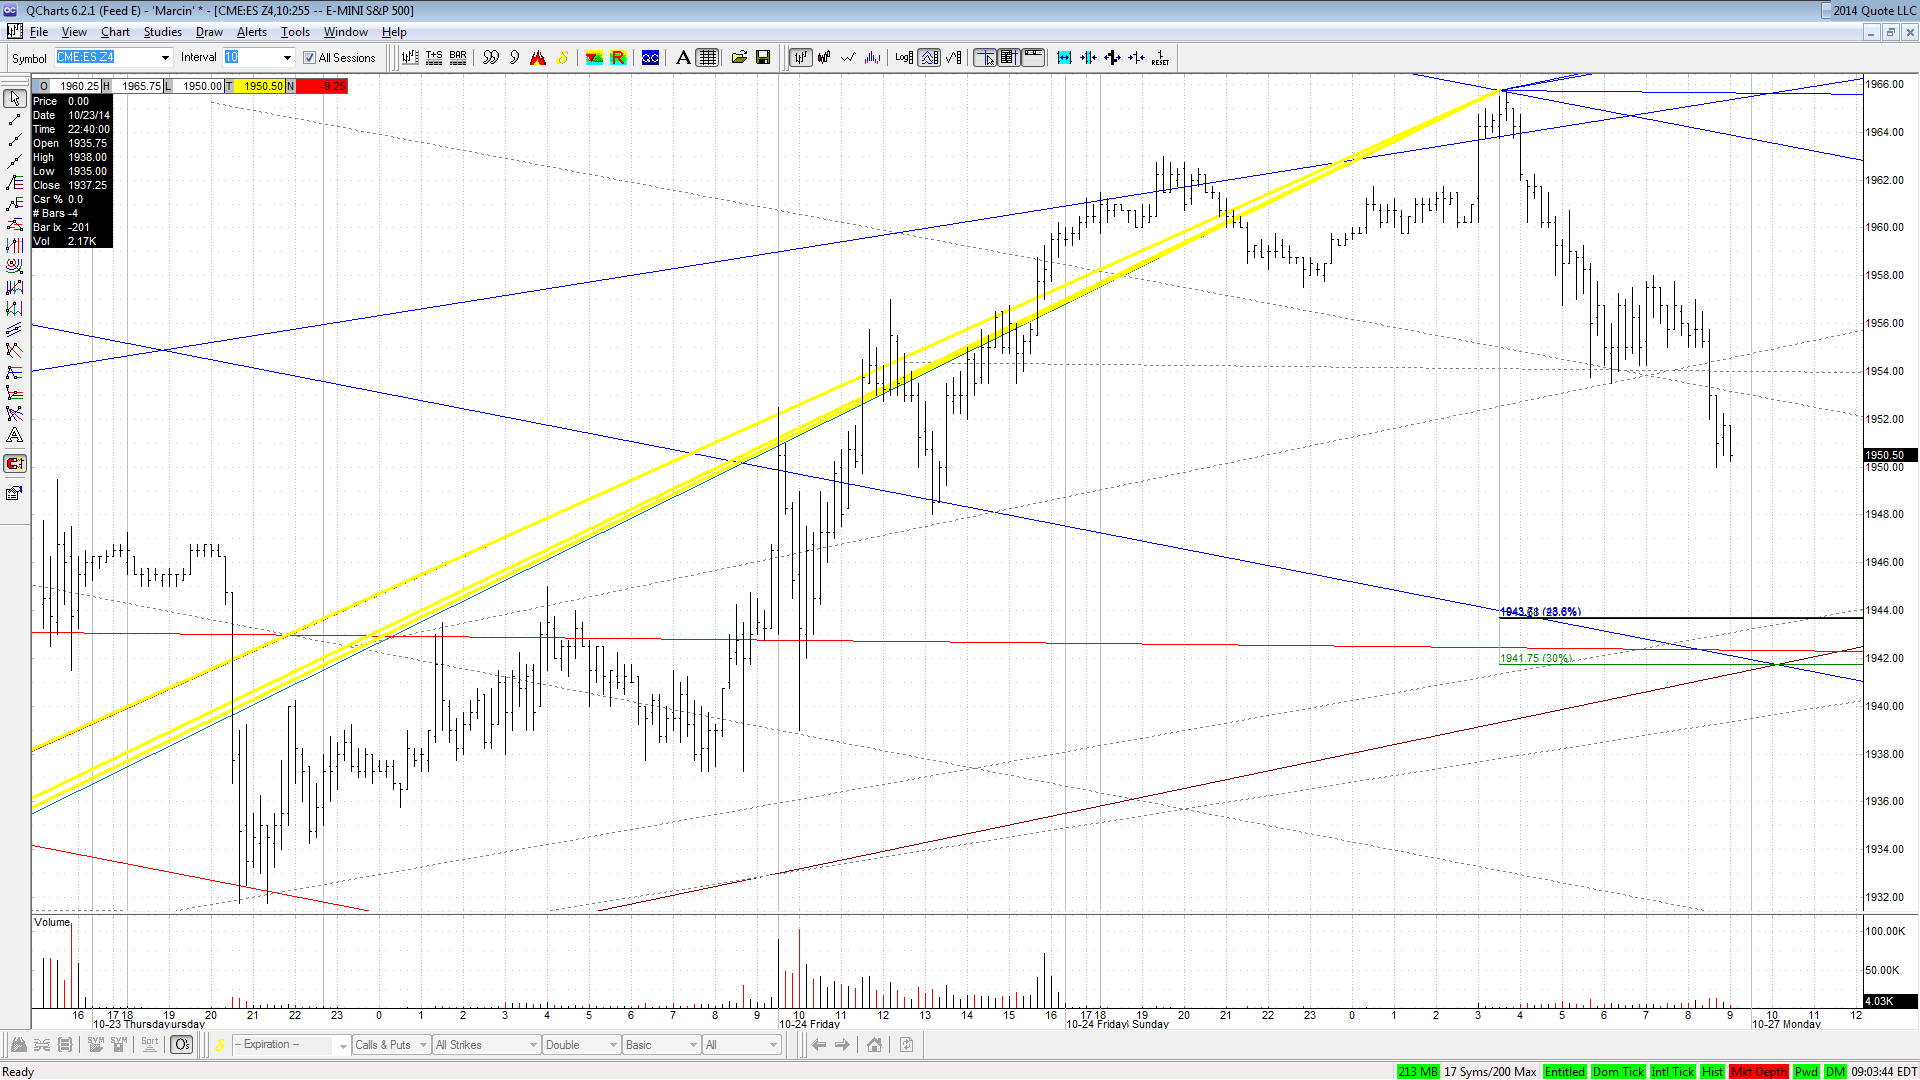
Starting it off. I'll quote my last post from last week.
"Anyway, the ES did something it usually doesn't do, and that's make any kind of move in the Friday after close mini session. This time it kept moving up, set a new high for the entire move, and closed almost at the high tick. It is now fully at the monster weekly backtest line. If this is a bear market, it should roll off this, and roll hard. There is a key area above, built from the immediate price action, and that comes in at 76-87, with a grouping of key Fibs at 94.00-95.50. I could see it hitting the lower end of the area, maybe a little above the lower end, and still be respecting the key TL backtest, but not much more.
Still, does it even seem remotely feasible that this is going to dump to significant new lows from here? The only hope I see at all is that not only do all pundits and analysts say no, it's completely and utterly an impossibility, most readers in here, I believe, are also saying no out loud right now. And that's not meant as a slight to the readers in here, who are among the most highly informed out there, I feel, it's more meant to imply just how good they are at sucking people in. We'll see. I don't really care, from a trading standpoint, what these maniacs do with it. So, that's what I'm working with as we reach arguably the most critical juncture perhaps in trading history."
JI
jimkane
Rep: 3,058
Posts: 33,089
From Slope of Hope. This shows why this backtest is so critical.
The SPX 55 week moving average was tested. The 3rd longest streak in history. The 4th longest (1998) resulted in a 22% correction. The 1st (1929) and 2nd (1987) longest streaks resulted in a 50% and 33% correction, respectively. History is not kind to such a long rally.
Source: http://slopeofhope.com/2014/10/why-this-bounce-is-different.html
JI
jimkane
Rep: 3,058
Posts: 33,089
This chart is just fantastic. And I am sickened by it even more than TK is. Look at how the market followed Real median Household Income, and then followed the Fed Balance Sheet.
http://slopeofhope.com/2014/10/all-in-one-chart.html
http://slopeofhope.com/2014/10/all-in-one-chart.html
JI
jimkane
Rep: 3,058
Posts: 33,089
Marcin, you around? I thought the European open wasn't for an hour? It's acting like it opened just there.
JI
jimkane
Rep: 3,058
Posts: 33,089
I just woke up and gave this a quick check, and I'm very, very happy with what I am seeing. I hope it continues. I'm going to be absolutely heartbroken if the downtrend doesn't resume in here. Trading-wise, who cares, it will be great in my view one way or the other, but I'm tired, after six and a half years, of a one-sided, manipulated market. Time for a change. Okay, back to bed, probably my just doing this post will create a bottom there...
MA
MarcinO
Rep: 67
Posts: 5,506
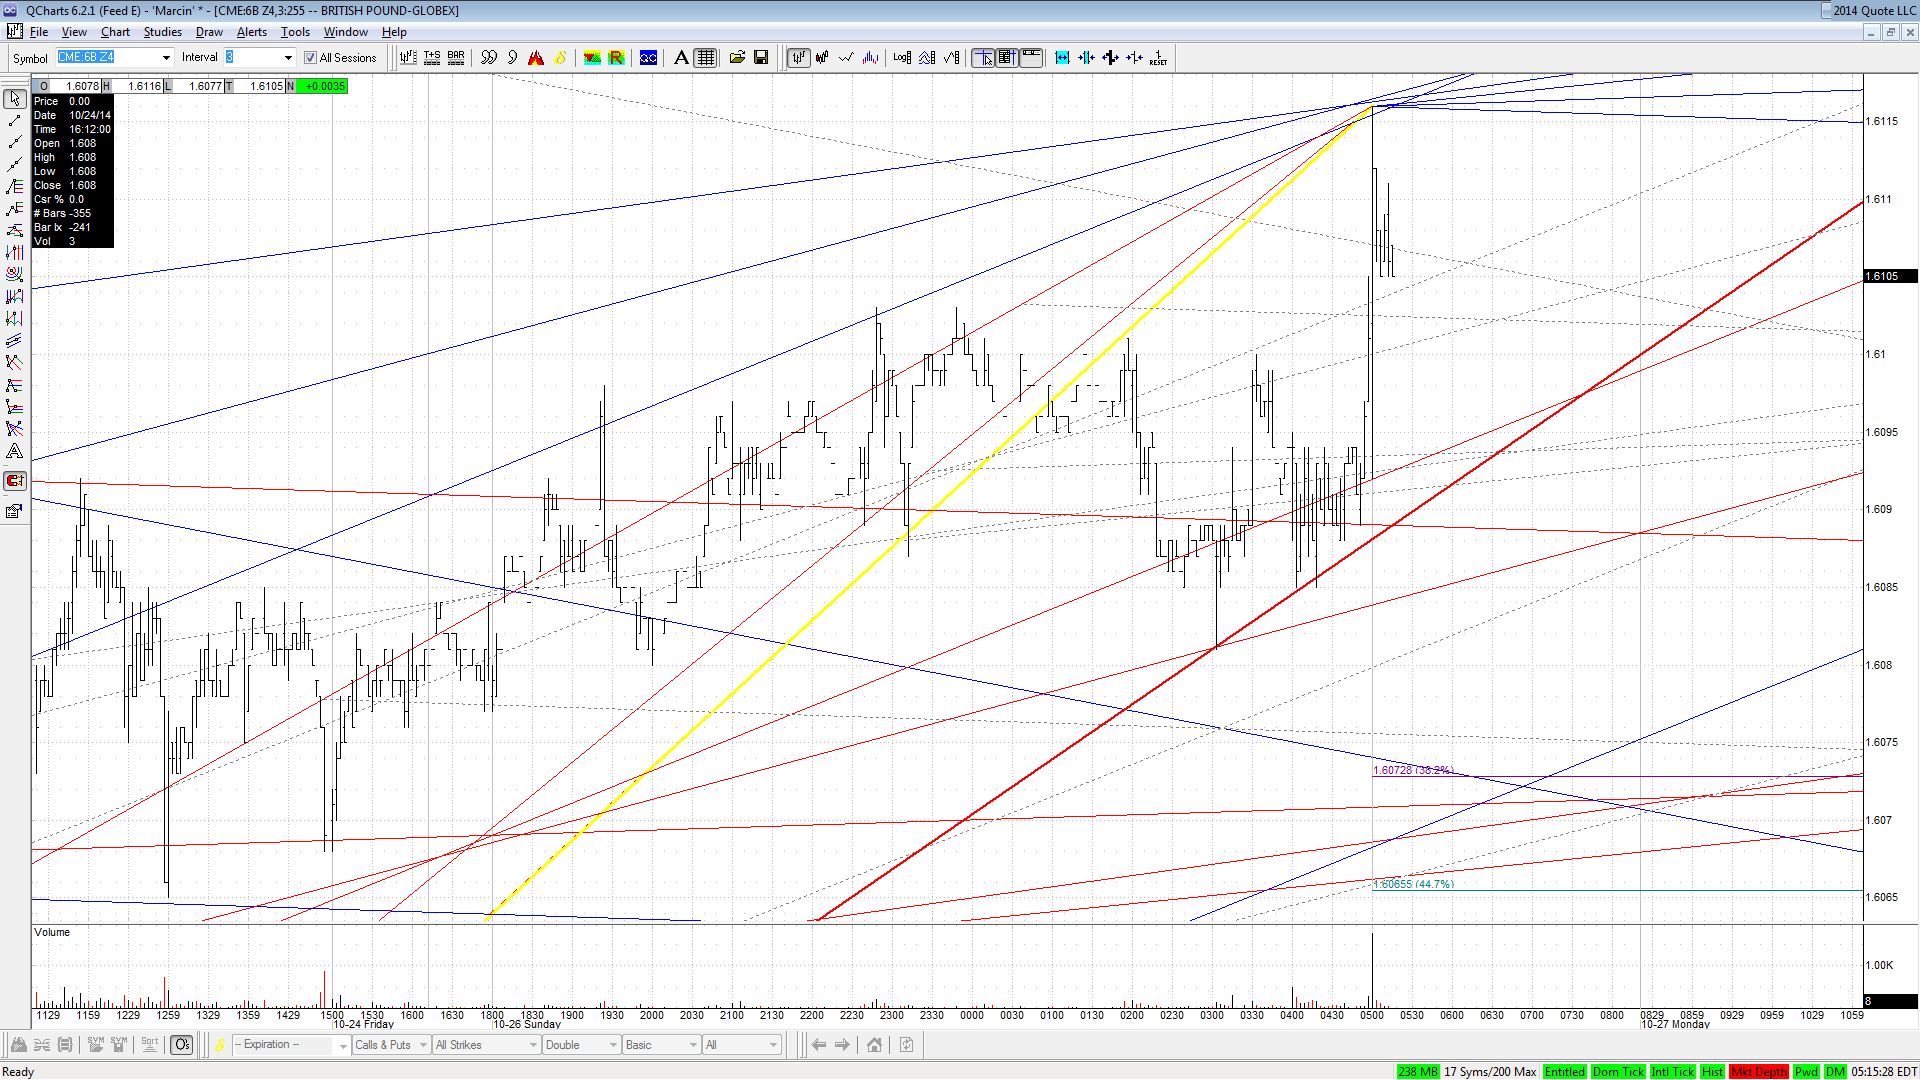
1.6105-15 was worth shorting.
It may stop around 1.6090 but 1.6070 is much better area.
It may stop around 1.6090 but 1.6070 is much better area.
Click image for original size
MA
MarcinO
Rep: 67
Posts: 5,506
Yes, they did final thrust up at 3, but the European open is at 4 EST this week. And the drop started at 4 for good.
Originally posted by jimkane
Marcin, you around? I thought the European open wasn't for an hour? It's acting like it opened just there.
MA
MarcinO
Rep: 67
Posts: 5,506
BTW. Cable made it to 1.6088 and is now finishing ABCD, which will hopefully send it to 1.6070 and maybe even to 45.
MA
MarcinO
Rep: 67
Posts: 5,506
42-44.
Continuation of an uptrend or just a short term reaction?
Continuation of an uptrend or just a short term reaction?
Click image for original size