ES Friday 11-21-14
here is how current On looks...I am trading now for the 65.25 retest...beautiful bell curve so far......weekly r3 sits up above Current On high at 2070.75....more later....we have a daily r3 at 70.75 too and an 88% probability band at 72.75...so I am making a zone at 70.75 - 72.75....( 1.28 band at 69.50 ) above there all I have is 95 % band up near 79...my thoughts are that the cash market will need to play with 2075 cash....so that zone is ES I think is in a good spot......I will not be buying up here even if we get small range and even if we are apporaching a good seasonal time.......often Monday after opt Ex aren't the greatest for the bullish side.......we'll see...should be a fun morning...we have some nice zones..my guess is that they will print the 65 area target in RTH.....
Click image for original size
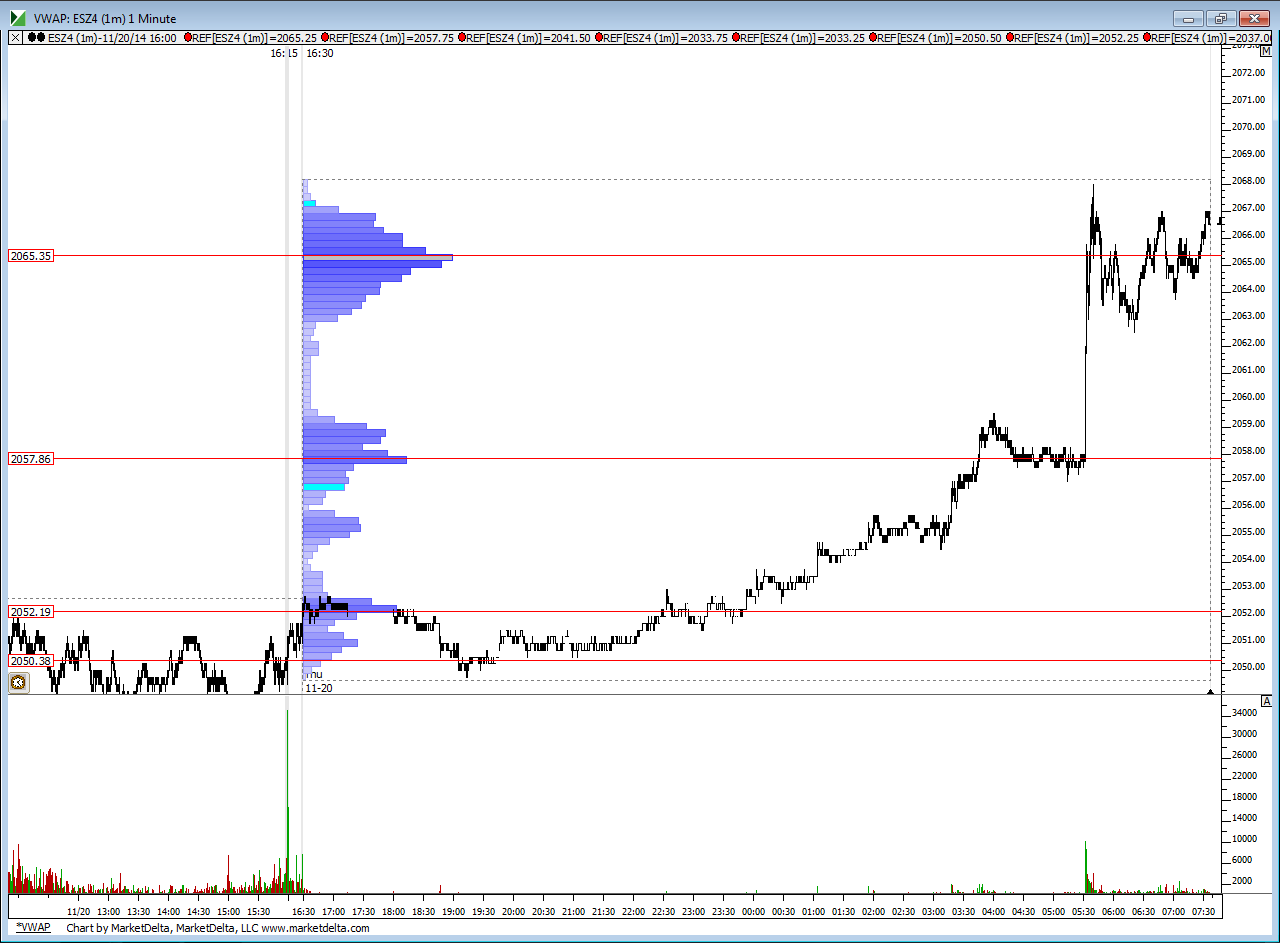
starting shorts at 68.75 in On today...very early for me..volume building between 65.25 and 66.25 so that is target zone
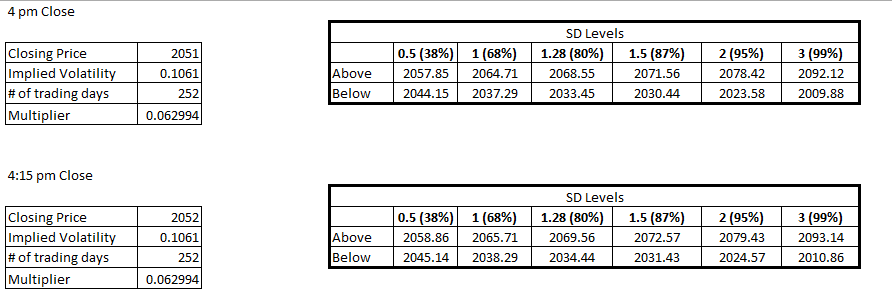
Correction. We are now near the 80% to 87% band. So a high chance of pullback but again, not 100%
critical zones summary for me
70.50 - 72.75
65 - 66 ...**** big magnet
57.75 - 59 **** spot where the volume came in from O/N and O/N greenies -- R2 today
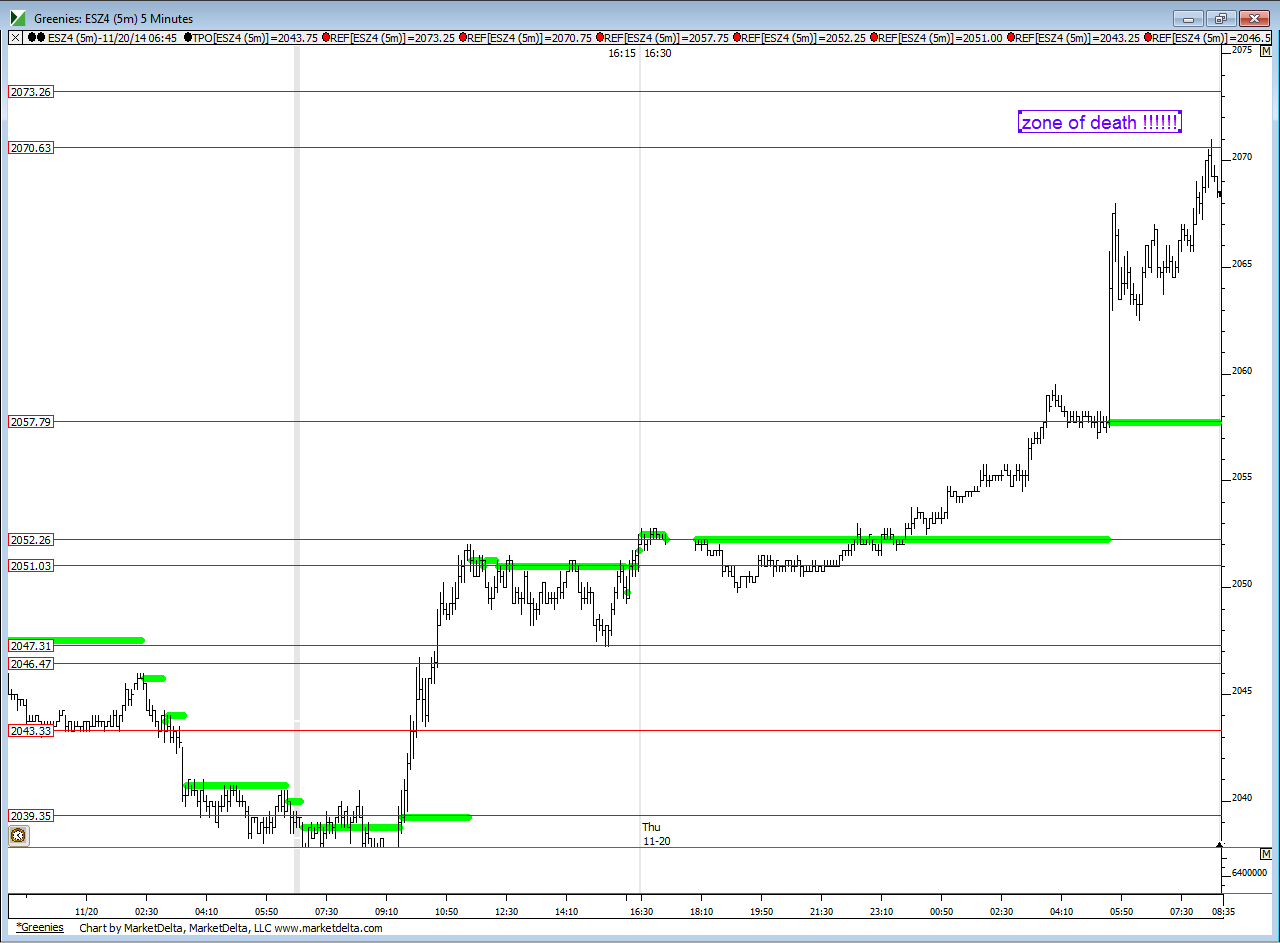
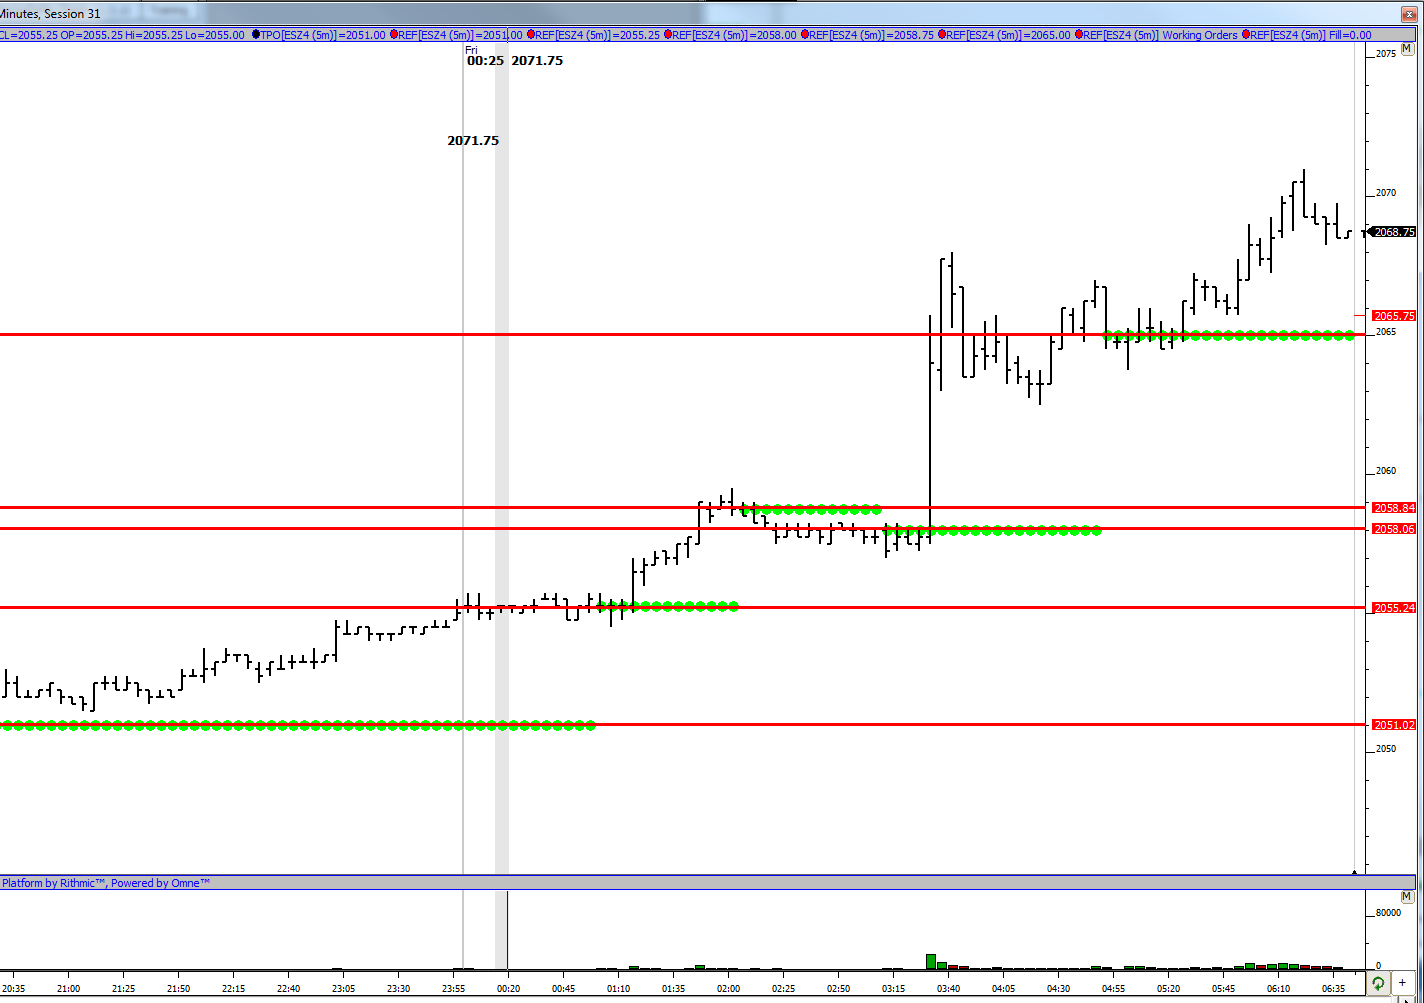
51-52 ** O/N greenies and day session greenies....here is update to O/N chart with my upper zone lines now snapped
this is current greenies chart
70.50 - 72.75
65 - 66 ...**** big magnet
57.75 - 59 **** spot where the volume came in from O/N and O/N greenies -- R2 today
51-52 ** O/N greenies and day session greenies....here is update to O/N chart with my upper zone lines now snapped
this is current greenies chart
Click image for original size
most days see us print a .5 or 1 sd band and it doesn't matter which side we open on from that...so for me that 65 band becomes an even stronger magnet....note how greenies chart doesn't pick up the volume cluster from my first chart posted today at the 65 - 66 area...
Bruce, I think your IB volume is again doing something strange. Here is my greenies chart. I see them at the 65 zone
Click image for original size
But I do agree, the 65 price should serve as a magnet and should be hit again. We have the 1 SD band there as well as the volume left behind there
thanks ...I'm sure it is...that is why I run the volume profile too as per chart one today....the greenies don't pick them all up....glad u can confirm
I like the idea and in hindsight it might be worth looking into....also look how often we trade and close beyond an 80 % daily band when we open outside of it......or how often we close beyond an r3 on the weekly pivot formula.....the problem I think for most ( or I should really only say for myself) is doing the back testing and also having some way to keep track of the market extreme anomolies.....there seems to be an endless supply of "conditions" and picking the ones to follow and test might be time consuming....for example I used to look at spx closes beyond the 2.5 bollinger band......not many occurrences but the next day usually doesn't drop and close much lower then the previous days low by more than 5- 7 points...many times we have up days or consolidation days following that....but waiting for that to happen and remembering to look for it was hard for me...I guess if you could automate the conditions you could give yourself a framework....I like your thinking Newkid...
Originally posted by NewKid
in hindsight, i wonder if the following thinking could have been applied this morning.
since we gapped up this high today into unchartered territory, would it have been prudent to hold for the gap close or at least O/N midpoint once we saw that we were not making new highs?
just need to be patient and hold. would be worthwhile to go back and look for such occurences....
Emini Day Trading /
Daily Notes /
Forecast /
Economic Events /
Search /
Terms and Conditions /
Disclaimer /
Books /
Online Books /
Site Map /
Contact /
Privacy Policy /
Links /
About /
Day Trading Forum /
Investment Calculators /
Pivot Point Calculator /
Market Profile Generator /
Fibonacci Calculator /
Mailing List /
Advertise Here /
Articles /
Financial Terms /
Brokers /
Software /
Holidays /
Stock Split Calendar /
Mortgage Calculator /
Donate
Copyright © 2004-2023, MyPivots. All rights reserved.
Copyright © 2004-2023, MyPivots. All rights reserved.