ES Monday 12-15-14
I sure hope Bruce feels better and will post...
someone I know sent me a link to a study of price performance of the S&P 500 cash index in Decembers when there are large jumps in the $VIX.
below is a link to the article and my response to him...
all data believed to be reliable, however no guarantees are implied or expressed.
The pullback in the market this year has triggered this signal... whether the historical pattern repeats has yet to be proven
This is not the Stock Trader's Almanac's mid December lows article, someone sent me a copy of this study,,, it looks like this guy has some neat studies at his blog site.
If you go to the link at the bottom of this e-mail, and then go to his blog you might find things worth knowing for the intermediate term
Maybe you should read the article first, then see my notes below...
http://finance.yahoo.com/tumblr/photoset-this-signal-has-perfect-record-of-forecasting-182907031.html
Here are my comments...
The author of the article is a little wrong in assuming that the VIX goes back to 1986... The original VIX was based on the S&P 100 (the $OEX options volatility) and that data did go back to 1986, BUT, the current VIX is based on Goldman Sacks studies of the S&P 500 Options volatility and it only goes back to 93 or 94... The S&P 100 Vix now uses ticker $VXO), So, for him to say back to 1986 for the VIX, is wrong unless Goldman has produced more back data (doubtful)
I wrote code to look at what he described. His description is wanting... like wanting more precise definitions...
there are 2 ways to interpret the description he offers of VIX High versus 1-month Low of VIX...
1) only compare the High reading of the VIX to the lowest VIX reading of the prior month of trade days (assume 22 trade days a month)
or
2) Only compare the high VIX reading to the lowest L of VIX established in DECEMBER ONLY.
I did not take the time to go to my historical files and pull out my VIX data of the past 28 years because I had enough... I went back to 2004...
He is saying that all 52 times the S&P500 closed higher than the close of the day that registered the extreme VIX reading. OK, well, based on my research of the recent past, that means that he is only looking at VIX Lows registered during the Month of December, not a 22 trade day lookback. (I can say that because I wrote two different sets of code to review which possible filter he was using... Back in 2012 I found the answer... he is comparing VIX H to VIX low established IN the Month of December, not on a 22 trade day look back. I can assume this because in December of 2012, the VIX H based on a 22 trade day look back registered a signal on 12/21/12, but the filter based on comparing VIX H to only the lows that actually occurred during December did not register until 12/27/12 and 12/28/12... The close for the year was above each of these closes, but it did not manage to close above the signal registered 12/21/12 (which was based on a 22 trade day lookback).
Well, if I am correct in this assumption (and this historical trend repeats again), I can tell you that all 4 of this December’s signals occurred when comparing the VIX H to the lowest VIX registered during the month of December...
this signal has been registered for the following trade days
12/9/14 SPX close was 2059.82
12/10/14 SPX close was 2026.24
12/11/14 SPX close was 2035.33
12/12/14 SPX close was 2002.33
and according that article (and assuming a repeat) as of the close on Dec 31, 2014, the S&P 500 should be 2059.82 or higher.
final runner is off at 2003 ahead of PV...I also took at 2006 on the way down at LVN and VA low of friday just in case......hope to be more with it tomorrow...value is working on being overlapping to lower so I would expect people to still try and sell all rallies...especially under the POc from friday and the va low..
1/2 gap fill is near On midpoint...I hope it keeps going for those with more money than me.....so 1998- 99 would be next key spot...then the 4 pm close..value players will want time to build up UNDER the selling spike/va low of friday now.......still a very tricky day and I don't envy those who trade longer term in the ES !
Bruce, you may choose this question as it might be too personal, but what exactly do you mean when you say you are out of ammo? You are obviously in the green for the day and also have a well funded account. Is it that you have a number that you try to hit for the day/week and then have no interest after hitting the said number? Or is it something else? Just trying to understand your thought process. I myself have a certain goal in mind for the day/week and anything more than that is gravy. The question is, how often should one chase the gravy?
meant to say, you may choose to not answer the question
"out of ammo means" that I do not have any more runner contracts on and working.....so even though I may comment on numbers like the 1998 - 1999 target I do not have contracts on working to go get those targets and am merely pointing out what I see for somebody else ...I usually do not have dollar goals for the day or week but look to be satisfied with higher probability trades and my bias........also my time frame which is the first 90 minutes as u know......but having some kind of goal whether it is a dollar amount, good trade probabilities or a time frame is a good idea for everyone.....
anything that can keep us from over- trading...anything that limits your amount of time actually in the market is a good thing !!
anything that can keep us from over- trading...anything that limits your amount of time actually in the market is a good thing !!
a look at what lurks under fridays lows..if they can push that out today...this is a monthly chart ...note the lvn/gap between Novembers lows and octobers highs..1988 - 1986...for some reason Market delta labels the monthly charts with the months mid date..the 14th of the month...
Click image for original size
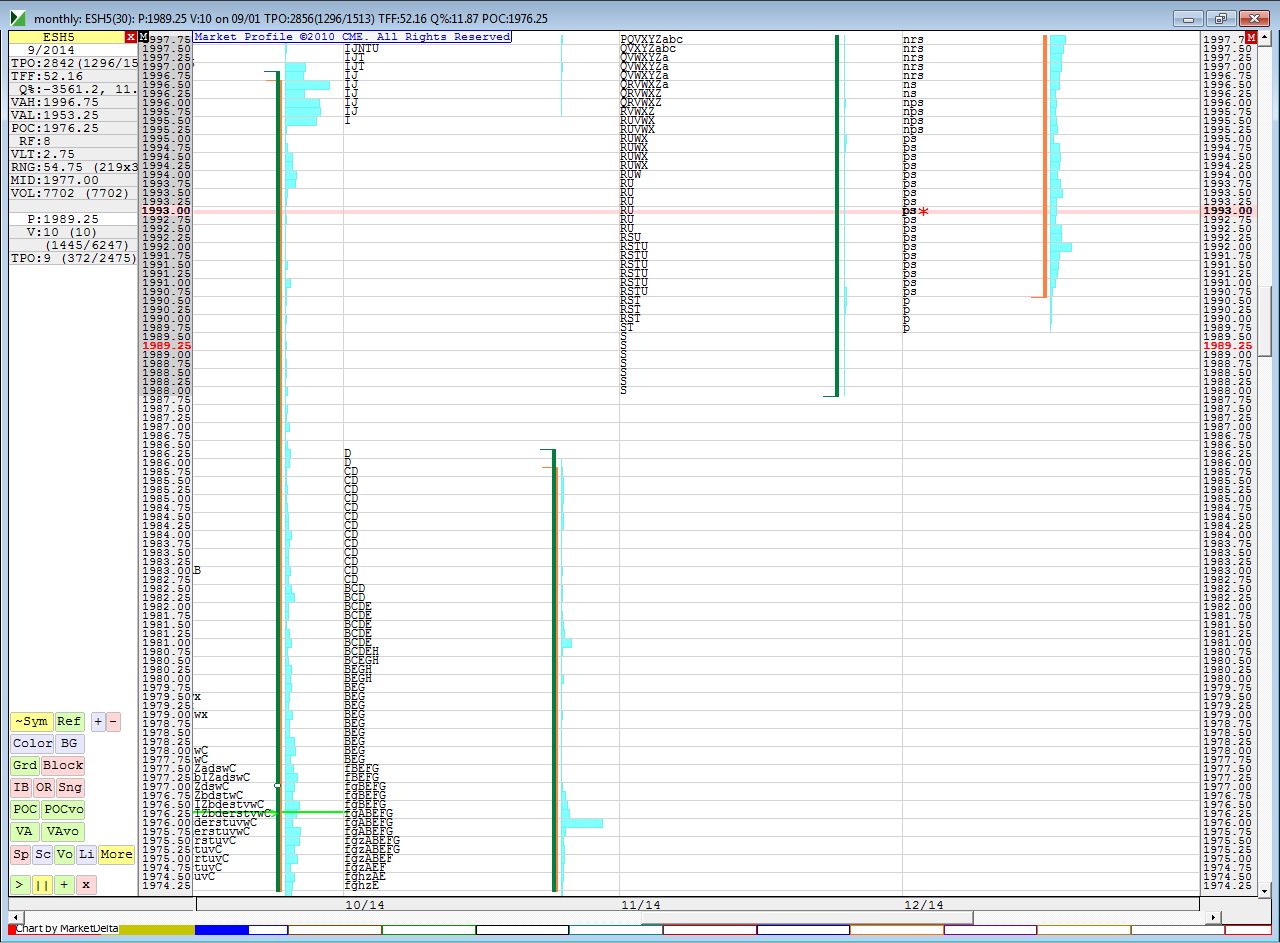
i think they will want 95.75 again...a lvn is there and they need to know more about the 4 pm close
I think we will see 1980 and 1987 reprint....so hunting SMALL longs in the 1975 - 77...a key zone for me and this seems like too much too soon
one sd down based on 365 days and 4 pm close gets us to 76 area too
for those still playing over lunch note how many single prints we have on the charts today so far....you could almost consider the hour breakdown as singles as we traded very little time there too
that's me gone at 88.50...gotta run...kids one pm band concert that I'm gonna be late for catchya all in the morning...good example of how important longer time frame reference points are and how often they get retested......quick rule is that we should never expect only one tpo to print at a weekly and monthly RTH high or low...that's my million dollar idea for today....ha !!!
Emini Day Trading /
Daily Notes /
Forecast /
Economic Events /
Search /
Terms and Conditions /
Disclaimer /
Books /
Online Books /
Site Map /
Contact /
Privacy Policy /
Links /
About /
Day Trading Forum /
Investment Calculators /
Pivot Point Calculator /
Market Profile Generator /
Fibonacci Calculator /
Mailing List /
Advertise Here /
Articles /
Financial Terms /
Brokers /
Software /
Holidays /
Stock Split Calendar /
Mortgage Calculator /
Donate
Copyright © 2004-2023, MyPivots. All rights reserved.
Copyright © 2004-2023, MyPivots. All rights reserved.