When switching contracts..
Sorry to post this here as it is not a chart. I was wondering how most handle Rollovers when looking at longer term market profiles? Do you just use the continuos contract ( I have never used one so I am unclear)? Will it show single prints and buying and selling tails from previous days? Does it give a good read on the high and low volume areas from previous days/weeks or whatever "look back" period you chose? Perhaps there is another method....and I am off track
Thanks
Bruce
Thanks
Bruce
What about using the SPYs instead of the cash index, as this would also provide volume data?
Good point poster. I've never traded the SPY's so don't know how well the SPY's volume would work as a proxy. I'm guessing that the volume peaks and drops in-sync with the futures market due to arbitrage?
Just in case anybody doesn't know what a SPY is here is the definition from Investopedia:
Just in case anybody doesn't know what a SPY is here is the definition from Investopedia:
quote:
Spiders - SPDRs
Shares in a trust that owns stocks in the same proportion as that represented by the S&P 500 stock index. Due to the acronym SPDR, Standard & Poor's Depository Receipts are commonly known as "spiders". Each share of a Spider contains one-tenth of the S&P 500 index, and so trades at roughly one-tenth of the level of the S&P 500. They trade on the American Stock Exchange (AMEX) under the ticker symbol SPY.
SPDRs are ETFs, and therefore trade like ordinary shares on the stock market. By trading like a stock, Spiders have continuous liquidity, can be short sold, provide regular dividend payments, and incur regular brokerage commissions when traded.
Spiders are used by large institutions and traders as bets on the overall direction of the market. They are also used by investors who believe in passive management - those who don't try to beat the market. In this respect, Spiders compete directly with S&P 500 index funds.
That's my observation. My guess is that this might now be true more than it ever was, as SPY volume is so huge, and options on the SPYs are now, I believe, the world's most heavily traded options. But, again, only a guess...
thanks poster!!
Thanks for all these ideas...I posted this question regarding rollover and key numbers to a fellow on another forum who uses Volume profiles.....here is his reply...perhaps this will stimulate some additional thoughts
"When rolling to a new month the only adjustment I make is to the value area on the day of the roll, by the amount of the gap. As far as volume is concerned if somebody bought a boatload of the YM at 11,090 during Feb, rolling to M6 does not alter this fact.
Commodities that are typically in steep backwardation or contango are a different story"
...if somebody bought a boatload of the YM at 11,090 during Feb, rolling to M6 does not alter this fact...
I think that you do have to be careful with that comment.
First of all to put it in context, the ES premium moving from Mar to Jun jumped from about 3 to 11 so about 8 ES points and so I'm going to simply multiply that by 10 and say that the premium in the YM jumps by 80 YM points when we move from Mar to Jun.
Back to the comment:
If that trader wanted to hold that boatload that they bought at 11,090 during Mar then they'd have to buy again in the Jun contract and sell their Mar contract. Their net entry price will be 80 points higher now and so (irrespective of P/L on the position) they'd have to adjust the entry price to (11,090 + 80) in order to evaluate stops, targets and general strategy parameters.
This is the same for anybody analysing the YM market in the Jun contract. If you considered 11,090 an important price because of the volume that traded at that price then you need to consider 11,090 + 80 as the same price in the Jun contract.
In order to confirm (or refute) what I have just said then try the following exercise:
Have a look at the price of the cash (DJIA) at 12pm on Wednesday and again on Thursday and compare the change in cash to the change in the active contract. (i.e. use H6 on Wednesday and M6 on Thursday.)
You will see that cash advances/declines way less than the active contract before the change active contract.
So to come back to the original comment, buying a boatload at 11,090 in the YM in Feb will be at a very different DJIA price level as it would once we move on to the Jun contract.
Assuming that interest rates don't change, then the only time that the 11,090 level could be comparable from one contract to another is when the number of days to expiry is the same. This is because the premium will be the same.
To illustrate this as an example, consider this. Say the boatload was bought at 11,090 in mid Feb and there were exactly 30 days to expiry. Say the premium to the Mar contract was 30 YM points. Now when there are exactly 30 days to expiry on the Jun contract (say mid May) the 11,090 level will hold the same significance because the premium should be the same.
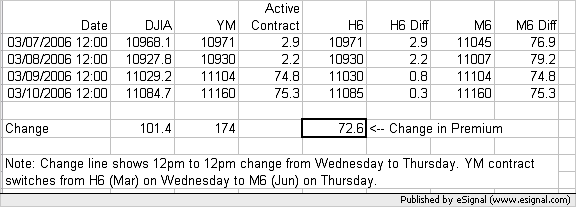
Before I end up with egg on my face for being wrong I put together a little spreadsheet to demonstrate what is going on. Here is an image of the change from one contract to the other. I have taken YM and DJIA opening prices at midday on the 2 days before rollover and then the rollover day and the subsequent day. Here is the image:
Note how from midday on Wednesday (3/8) to midday on Thursday (3/9) the DJIA rose 101.4 points but the active contract in the YM rose 174 points. So my point is, be careful when comparing pre and post rollover prices and take into account the number of days to expiry if comparing 2 different contracts.
...and here is the spreadsheet in case you want to check the calculations.
Click image for original size
Note how from midday on Wednesday (3/8) to midday on Thursday (3/9) the DJIA rose 101.4 points but the active contract in the YM rose 174 points. So my point is, be careful when comparing pre and post rollover prices and take into account the number of days to expiry if comparing 2 different contracts.
...and here is the spreadsheet in case you want to check the calculations.
Click link to access uploaded file:
YM_to_DJIA_premium_at_Rollover.xls
YM_to_DJIA_premium_at_Rollover.xls
Emini Day Trading /
Daily Notes /
Forecast /
Economic Events /
Search /
Terms and Conditions /
Disclaimer /
Books /
Online Books /
Site Map /
Contact /
Privacy Policy /
Links /
About /
Day Trading Forum /
Investment Calculators /
Pivot Point Calculator /
Market Profile Generator /
Fibonacci Calculator /
Mailing List /
Advertise Here /
Articles /
Financial Terms /
Brokers /
Software /
Holidays /
Stock Split Calendar /
Mortgage Calculator /
Donate
Copyright © 2004-2023, MyPivots. All rights reserved.
Copyright © 2004-2023, MyPivots. All rights reserved.