When switching contracts..
Sorry to post this here as it is not a chart. I was wondering how most handle Rollovers when looking at longer term market profiles? Do you just use the continuos contract ( I have never used one so I am unclear)? Will it show single prints and buying and selling tails from previous days? Does it give a good read on the high and low volume areas from previous days/weeks or whatever "look back" period you chose? Perhaps there is another method....and I am off track
Thanks
Bruce
Thanks
Bruce
Well if you switch over to the M6 contract then your chart's indicators will recalculate the single prints etc. from the M6 contract on previous days. Problem is, that if there was really light volume then tails and single prints might not be that accurate.
The other option is to take the previous contract (H6 in this case) and scale it using a formula based on the interest rate and days to expiry and splice it into the new contract. This is fairly complicated and I don't know of anybody that does this. If you plot the premium of the new (M6) contract today against the old (H6) from yesterday you will see that the ES/SP premium to the cash jumped from around 3 to around 11. This represents the new premium because of the time to expiry of the new contract.
You could retrospectively add the difference of 8 to previous numbers that you carry forward from the old contract but this is a quick and dirty way of doing it.
Personally, I just switch to the new contract and go from there and generate new singles, tails etc. based on the new contract.
Thanks Guy..! I guess I was really trying to get a handle on these longer term profile charts to see if they have any value......and am especially curious regarding a longer term Volume profile that would show the peaks and valleys ( high and low volume)as these may ( or may not) be important. So once we rollover those peaks and valleys are gone ( I think ) if you are looking at the current contract...Gheesh...this can get complicated....So far for me the " jury is still out" on the effectiveness of the longer term profiles but I'll be watching...
Bruce - I don't know the effectiveness of the longer term profiles so can't comment on that.
However, from today forwards, if you want to look at a longer term profile using either TPO's or Volume then you're going to have to do some sort of calculation on the H contract's prices to adjust them to reflect what they should/would be in they were trading to a June expiry date. That is the only way that you will be able to compare like with like - or should I say like with synthetic like.
Unfortunately none of the charting platforms do this automatically (that I know of) so the only way I can think of doing this is to write a program yourself or an indicator that does the adjustments on a charting platform. Otherwise you're going to have to start building a new long term profile from now forwards. This also means that the longest long term profile can only be 3 months long (about 60 trading days) and when a new profile starts you won't be able to see a longer term profile than the number of trading days since rollover.
That was a bit of a long winded way of saying something fairly simple - my apologies.
I've come to rely on the longer term profiles, and being new to to index futures, I'm not sure what to do. I've stopped trading today after hitting my daily loss limit and I may not trade tomm. until I can get my arms around how to look at the ES moving forward.
Sorry to hear about your loss today popdoc. Do you attribute you loss today to not being able to see the longer term profile for this contract?
Partly that, and partly becasause I felt like I was driving blind....my MP levels (I use both TPO and volume based)didn't make sense on my ES #F chart or my ES M6 chart. My first experince with rollover and very confusing.
Lots of people consider certain trading days as no trade days. For example, Fed Days, Rollover Days, Fridays between holiday Thursday (such as Thanks Giving) and weekends etc.
I know that some traders make appointments to do all their chores (dentist etc.) on those days instead of trading. I've just gone through my data base of trades to see if Rollover Day has had any adverse impact on my trading in the past. i.e. Have my trades on average been losers or winners on Rollover Days. The result was that Rollover Days have, in the past, had no adverse effect on my trading performance. Given that information I don't see any reason not to trade them - however, for you, if you have come to rely heavily on the long term profile and you don't have this information to trade then it looks best to take today and tomorrow off from trading. Perhaps at this time of the year you can take a long 4-day weekend. It would be a good break from trading for you and you could plan something de-stressing know that you will have 2 solid days of trading data to look at next time you return to trading on the Monday to help build your longer term profile.
Hope this helps.
There's something really obvious that I didn't think of mentioning. You could look at the cash index for Market Profile support and resistance and key off the premium from there to execute your trades. So basically the signals would come from the cash and you would execute your trades in the ES. The down side is that the cash index doesn't have associated volume - unless you can mix the NYSE volume to it as a proxy - but that's not like for like...
That's a good idea - to use the cash index for a long term profile, thanks.
What would I use for the premium and wouldn't that premium change so that continuous adjustments would be neccessary?
A related topic, on the daily notes area, was the UVA, POC, LVA calulated using yesterdays ES M6 data?
What would I use for the premium and wouldn't that premium change so that continuous adjustments would be neccessary?
A related topic, on the daily notes area, was the UVA, POC, LVA calulated using yesterdays ES M6 data?
Yes the premium would change each day in a linear fashion to expiry day. The premium today is about 11 points on the new contract and yesterday was about 3 points on the expiring contract. Assuming that interest rates don't change between now and expiry and assuming that 11 is an accurate read for today then you would extrapolate that number forward to the June expiry date.
Yes, in the Daily Notes area, the data base is adjusted backwards to use the June contract from the previous Monday (2 Mondays ago) forward - so the weekly pivots and MP numbers etc. are all from the M6 contract.
Yes, in the Daily Notes area, the data base is adjusted backwards to use the June contract from the previous Monday (2 Mondays ago) forward - so the weekly pivots and MP numbers etc. are all from the M6 contract.
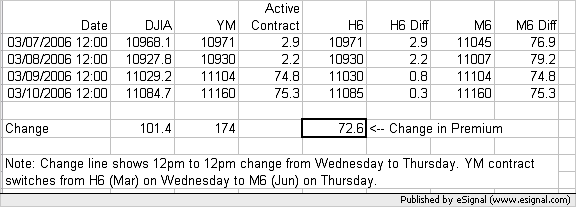
Before I end up with egg on my face for being wrong I put together a little spreadsheet to demonstrate what is going on. Here is an image of the change from one contract to the other. I have taken YM and DJIA opening prices at midday on the 2 days before rollover and then the rollover day and the subsequent day. Here is the image:
Note how from midday on Wednesday (3/8) to midday on Thursday (3/9) the DJIA rose 101.4 points but the active contract in the YM rose 174 points. So my point is, be careful when comparing pre and post rollover prices and take into account the number of days to expiry if comparing 2 different contracts.
...and here is the spreadsheet in case you want to check the calculations.
Click image for original size
Note how from midday on Wednesday (3/8) to midday on Thursday (3/9) the DJIA rose 101.4 points but the active contract in the YM rose 174 points. So my point is, be careful when comparing pre and post rollover prices and take into account the number of days to expiry if comparing 2 different contracts.
...and here is the spreadsheet in case you want to check the calculations.
Click link to access uploaded file:
YM_to_DJIA_premium_at_Rollover.xls
YM_to_DJIA_premium_at_Rollover.xls
Emini Day Trading /
Daily Notes /
Forecast /
Economic Events /
Search /
Terms and Conditions /
Disclaimer /
Books /
Online Books /
Site Map /
Contact /
Privacy Policy /
Links /
About /
Day Trading Forum /
Investment Calculators /
Pivot Point Calculator /
Market Profile Generator /
Fibonacci Calculator /
Mailing List /
Advertise Here /
Articles /
Financial Terms /
Brokers /
Software /
Holidays /
Stock Split Calendar /
Mortgage Calculator /
Donate
Copyright © 2004-2023, MyPivots. All rights reserved.
Copyright © 2004-2023, MyPivots. All rights reserved.