ES Wednesday 9-9-15
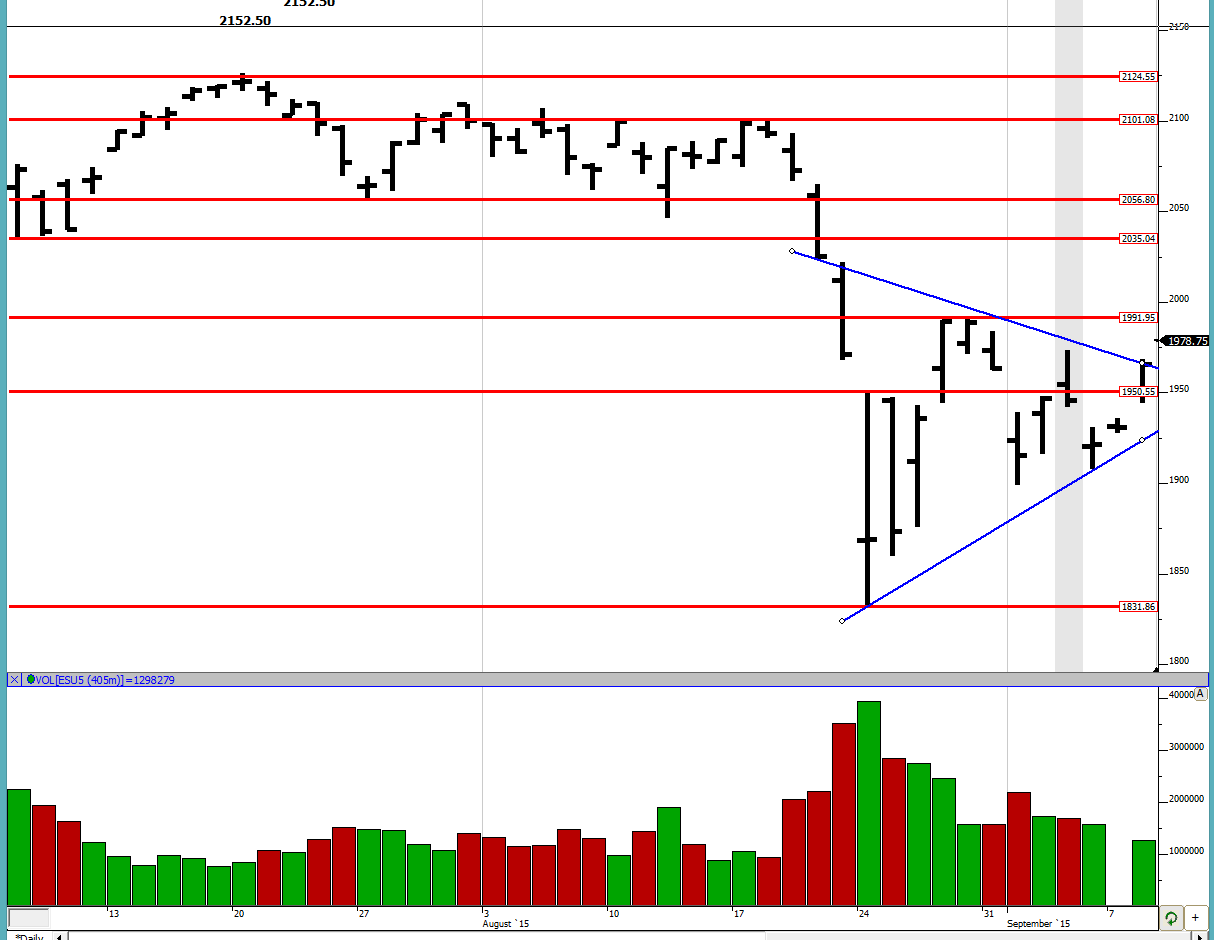
Good evening to all. Looking at the daily chart we can see that we are in a compressing triangle, depending on how we draw it. I am still seeing whether we take out 1991 or 1831 and after taking it out if we continue. That is going to be critical in my opinion so I will be on the look out for that. Similarly I will be monitoring the triangle breakout as well.
Greenies: 1894, 1923.25, 1949, 1979, 1995, 2014.25, 2053.25, 2077.75
Bonus weekly info: Last week's high was 1983.75 and the week before was 1991. So look out for those levels to provide some resistance as well as to act as guidance on the upside.
Profile:
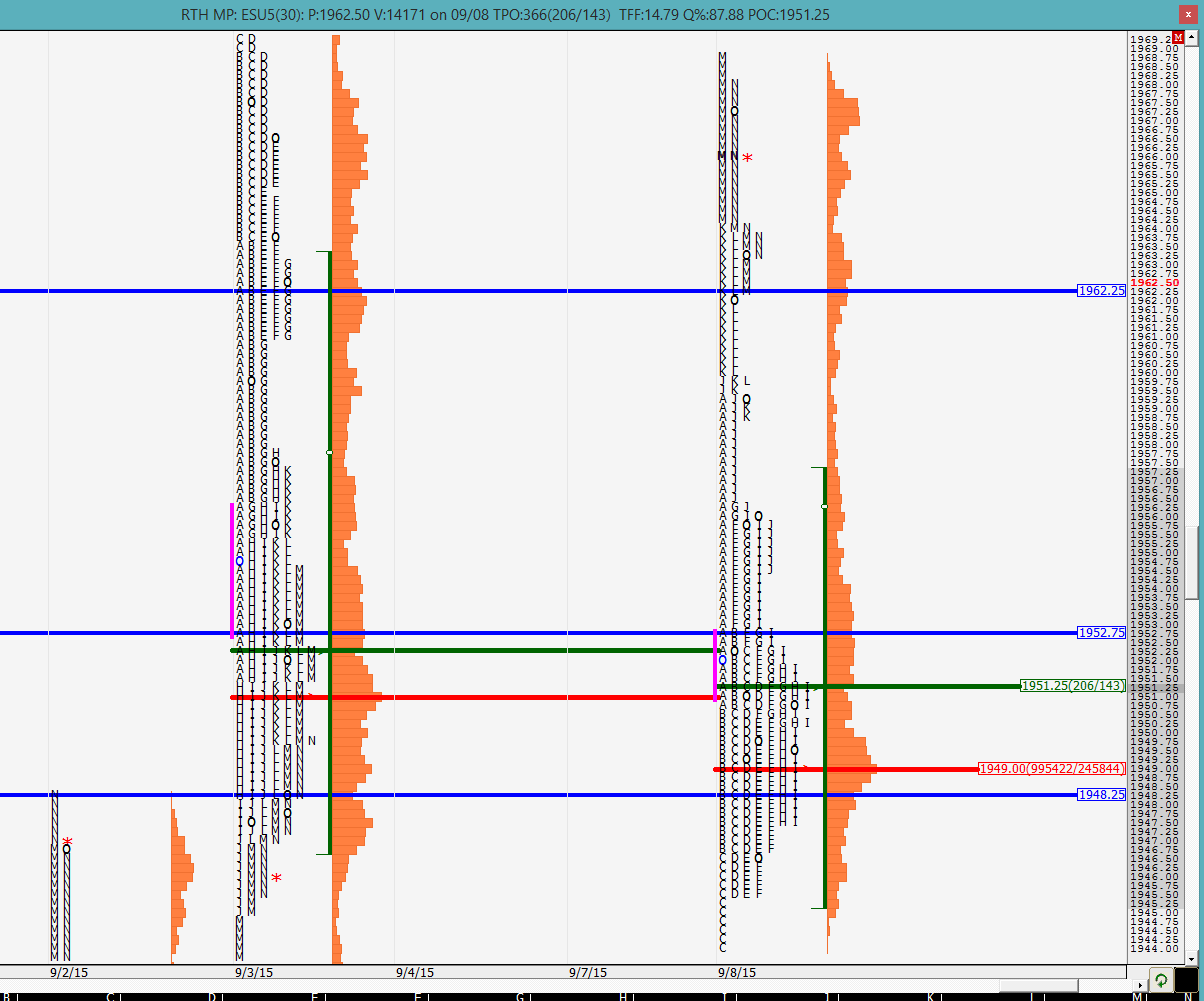
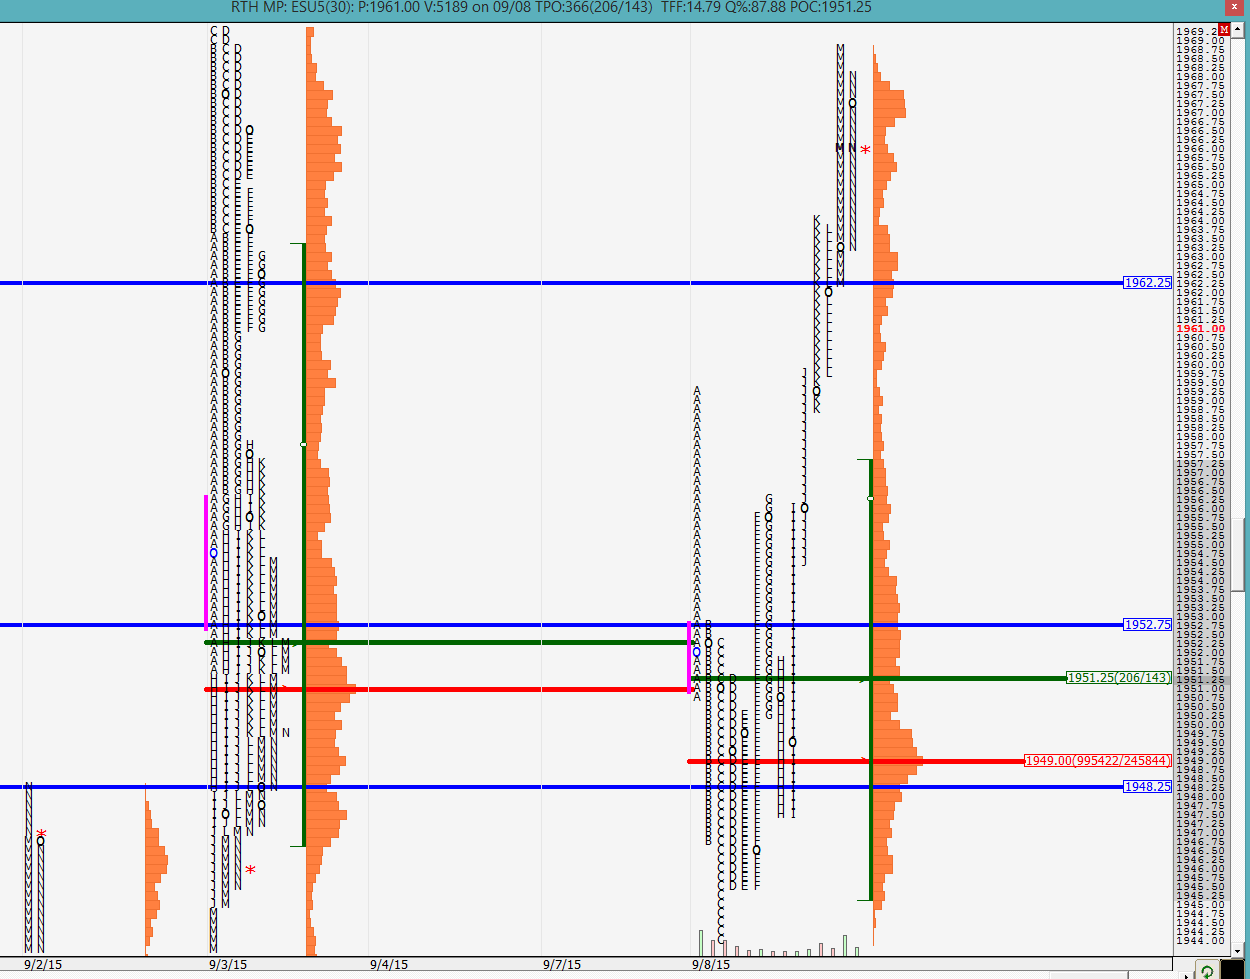
Today was a strong day for the buyers as the close was far from the VPOC of 1949. A late day rally drove us to the highs. The profile looks almost "b" shaped, except for a few anomalies, and that is usually an indication of short covering. I am not completely sure if this was indeed short covering or buyers stepping in but it should be interesting to see how the next few days go and if we are able to get over any of the upside references or if the markets rolls over again.
The split profile shows some liquidation/overnight inventory adjustment/selling in the first 3 periods before the buyers came in to defend the single prints from 9/3 and pushed the market higher possibly trapping some shorts in the process. Recently selling every rally has worked fairly well and traders are going to keep trying that approach until it fails and they are proven wrong, which they were today.
As mentioned earlier, we are approaching a few demarcation points on the upside so keep an eye out on those. There have been rumors/guessing in the market with regards to world-wide Fed policies so I am not sure if all this buying is happening just on hope. But until anything is proven wrong, stay with it.
We will see how the O/N inventory plays out in the morning and go from there. Good luck to all.
Greenies: 1894, 1923.25, 1949, 1979, 1995, 2014.25, 2053.25, 2077.75
Click image for original size
Bonus weekly info: Last week's high was 1983.75 and the week before was 1991. So look out for those levels to provide some resistance as well as to act as guidance on the upside.
Profile:
Today was a strong day for the buyers as the close was far from the VPOC of 1949. A late day rally drove us to the highs. The profile looks almost "b" shaped, except for a few anomalies, and that is usually an indication of short covering. I am not completely sure if this was indeed short covering or buyers stepping in but it should be interesting to see how the next few days go and if we are able to get over any of the upside references or if the markets rolls over again.
Click image for original size
The split profile shows some liquidation/overnight inventory adjustment/selling in the first 3 periods before the buyers came in to defend the single prints from 9/3 and pushed the market higher possibly trapping some shorts in the process. Recently selling every rally has worked fairly well and traders are going to keep trying that approach until it fails and they are proven wrong, which they were today.
Click image for original size
As mentioned earlier, we are approaching a few demarcation points on the upside so keep an eye out on those. There have been rumors/guessing in the market with regards to world-wide Fed policies so I am not sure if all this buying is happening just on hope. But until anything is proven wrong, stay with it.
We will see how the O/N inventory plays out in the morning and go from there. Good luck to all.
The O/N inventory is 100% net long (save for a few ticks but i would classify it as such) and the ONH was 3 ticks higher than our current range high of 1991. No surprises there as nobody wants to go above that level even in O/N until it is resolved in RTH. We would be opening close to the range high of 1991 with the current O/N VPOC at 1986. Either we look above 1991 and fail to the other end, look above it and chop around in the range below or look above and go. As koolblue noted, the odds are high of a retrace because we have basically shot up for the past few trading sessions and are likely in for some retracement, but we would need to see some price action to confirm a move in either direction.
today could have some fireworks because we have come to an inflection point so be careful out there. it should be another interesting day. good luck to all.
today could have some fireworks because we have come to an inflection point so be careful out there. it should be another interesting day. good luck to all.
we also do have a greenie at 1995 so if there is an initial surge at the open, that could be a pausing point
the O/N mid-pt is 1978 even
30 min VPOC at 1981
attempting to close the gap but the move down seems to have happened on low volume. is this simply O/N inventory adjustment?
Click image for original size
The profile looks very stretched and they managed to close the gap. VPOC is still at 1981. Good case for a long.
Click image for original size
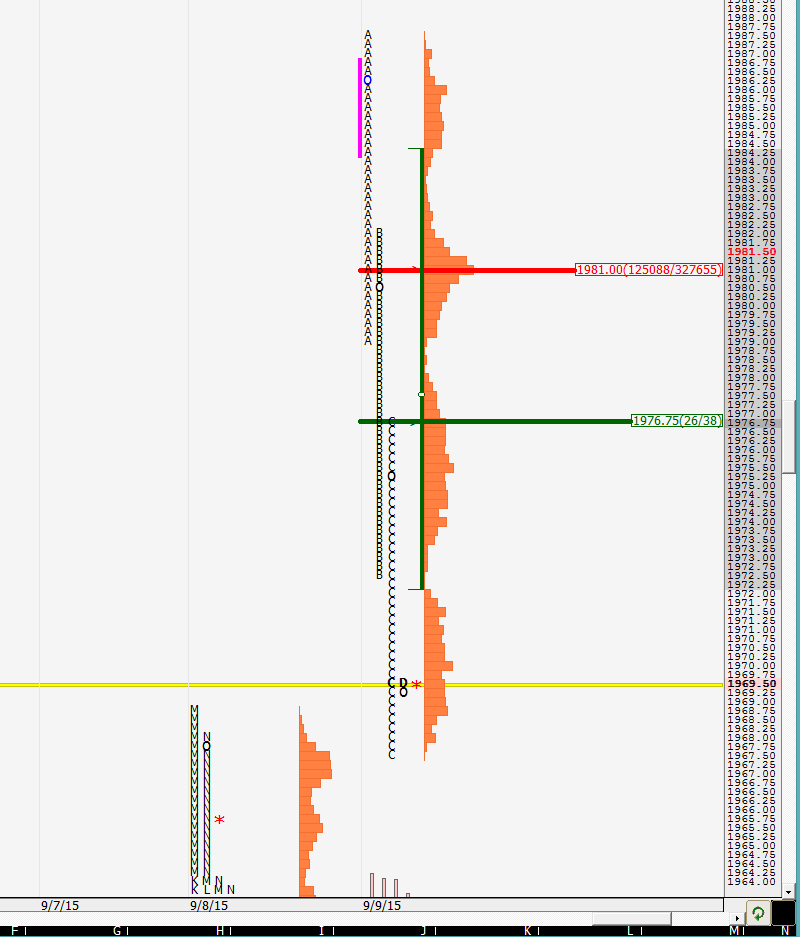
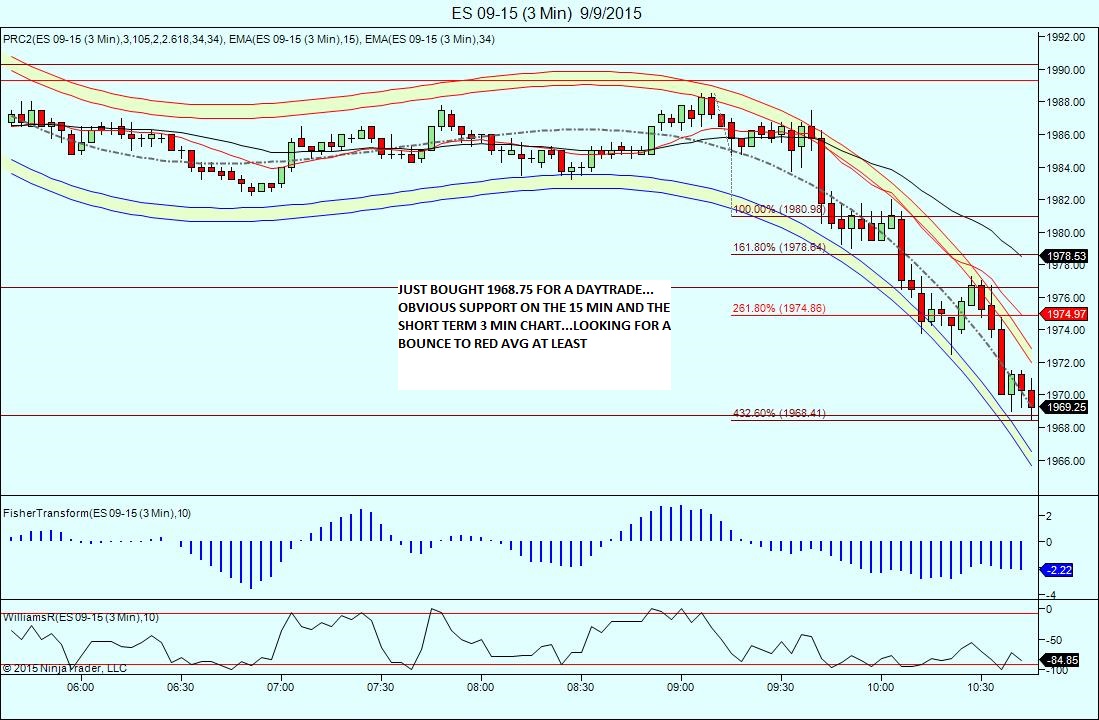
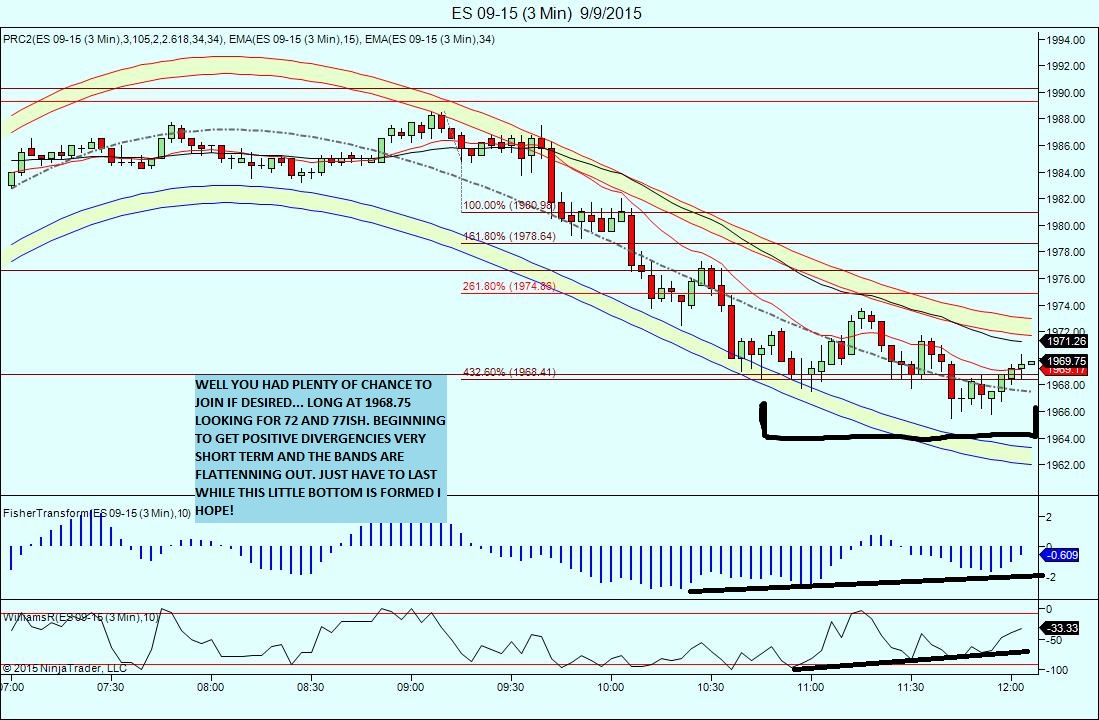
Normally i use a 4 point stop on these daytrades...this time my stop is at 1965.00 . First target would be the 72 area and ultimatly the 77 handle.
Click image for original size
great call kool so far
looks like folks were front running the greenie/VPOC of 1949
Emini Day Trading /
Daily Notes /
Forecast /
Economic Events /
Search /
Terms and Conditions /
Disclaimer /
Books /
Online Books /
Site Map /
Contact /
Privacy Policy /
Links /
About /
Day Trading Forum /
Investment Calculators /
Pivot Point Calculator /
Market Profile Generator /
Fibonacci Calculator /
Mailing List /
Advertise Here /
Articles /
Financial Terms /
Brokers /
Software /
Holidays /
Stock Split Calendar /
Mortgage Calculator /
Donate
Copyright © 2004-2023, MyPivots. All rights reserved.
Copyright © 2004-2023, MyPivots. All rights reserved.