ES Thursday 9-10-15
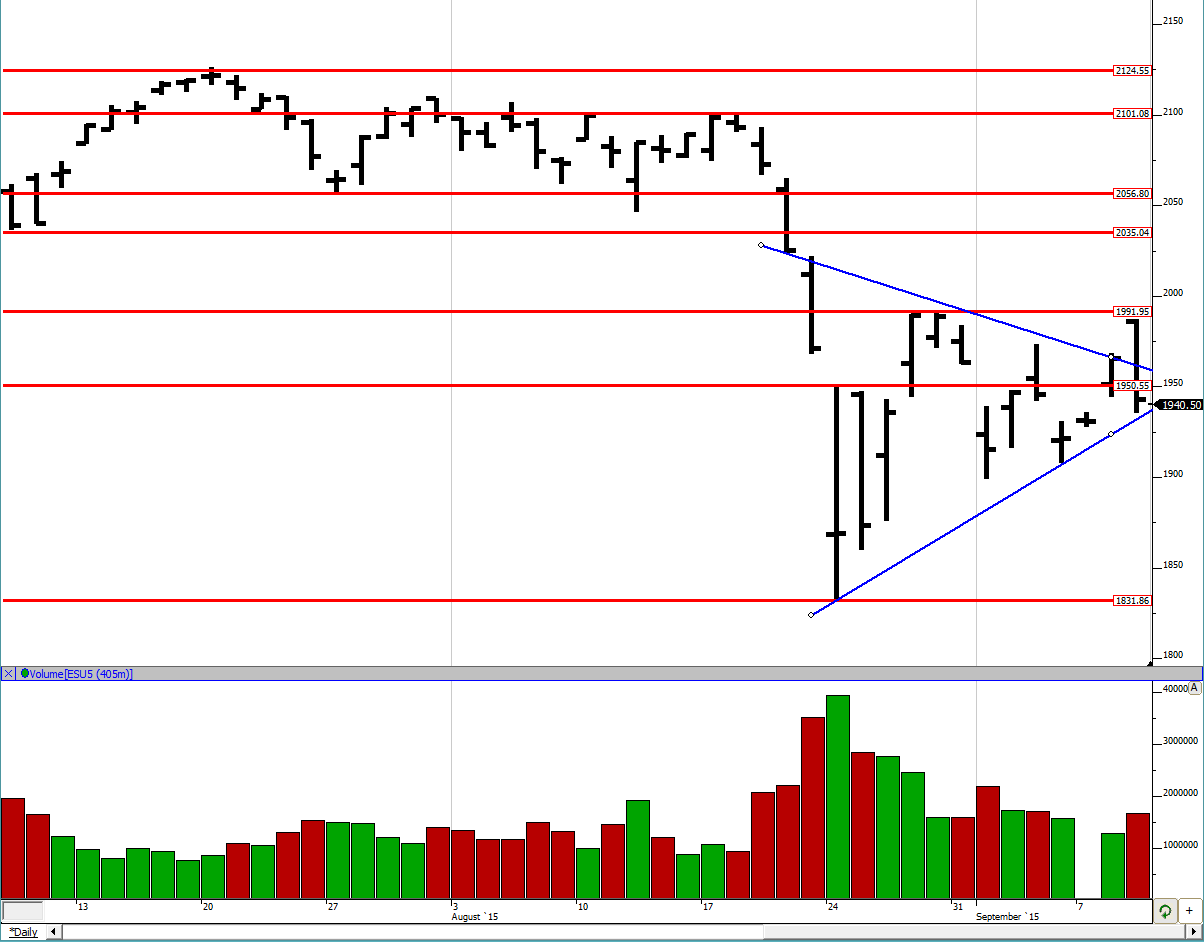
Good evening to all. As can be seen from the daily chart, we opened outside the triangle right at the top of the trading range near 1991. As a matter of fact, in RTH we could not even get to 1991 and the market rolled over. As suspected, the market had probably moved up too quickly and as we were close to the top of the trading range, folks were ready to sell there. We can see that we stopped before the ascending line of the triangle so that is of interest to me. Tomorrow if the selling continues, we could potentially go to last week's low of 1898.75. If that is broken, then we go the bottom of the trading range to 1831. On the other hand, if buyers come in to defend this level and if we get back to the 1991 level, then that would be the third visit there. The semi-permeable membrane would have already gotten weak with 2 previous blows to it and could give away to a third blow. So I think the rest of the week could be interesting. Of course, we could just churn back and forth as well until the Fed meeting so stay open to all possibilities.
Greenies: 1894, 1923.25, 1970, 1981, 1986, 1995, 2014.25, 2053.25, 2077.75
Profile:
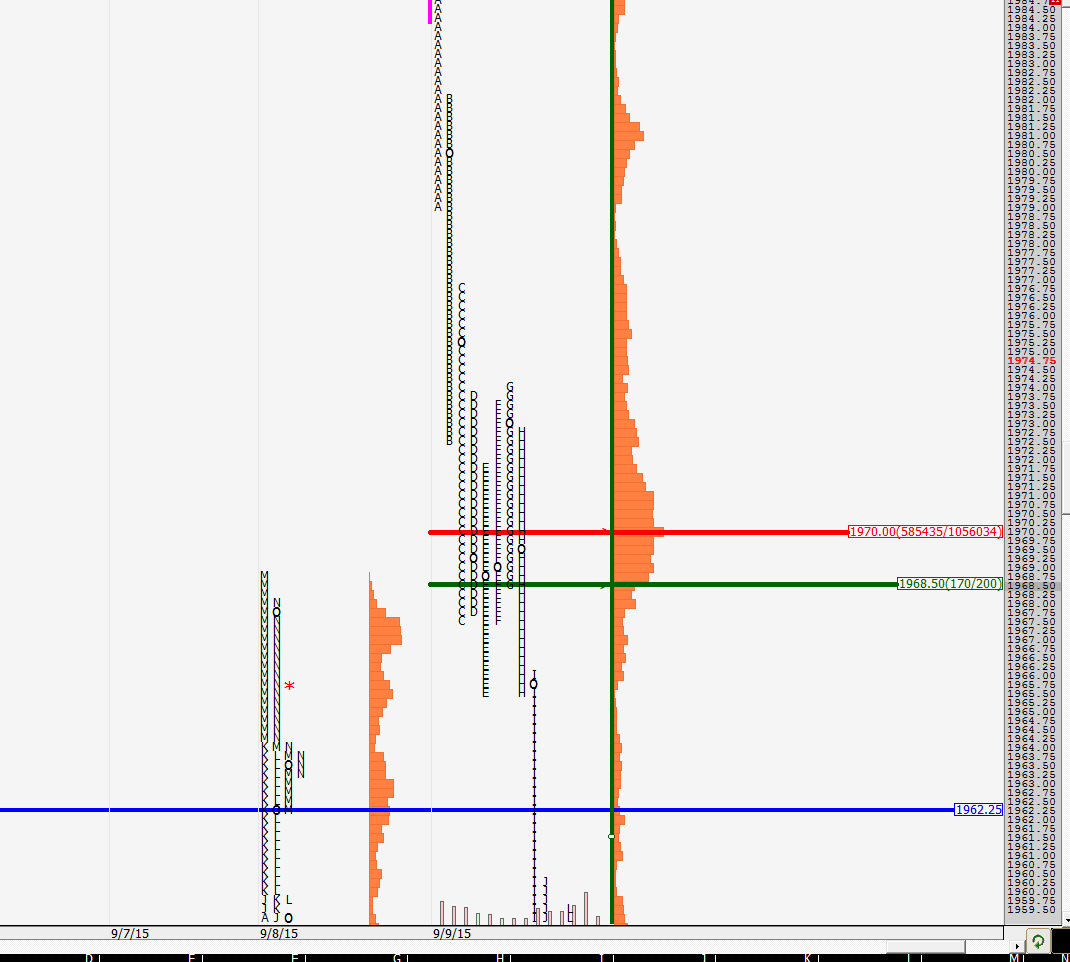
Due to the large range on the day, I had to really shrink the y-axis to see the entire day. We can see that the VPOC on the day was 1970, which is really far from the low and close of the day. We have been seeing that more often of late. Although it is hard to see on the chart, we had 4 distributions today i.e. regions separated by single prints. This is a lot and the odds of them getting cleaned up are high. We closed in the lowest distribution and the VPOC was in the second distribution from the top. Single prints from 1943.75 to 1949.5, 1960.5 to 1965.25 and 1977 to 1978.75. These are the single prints creating the distributions with the buying and selling tail at the extremes in addition to these.
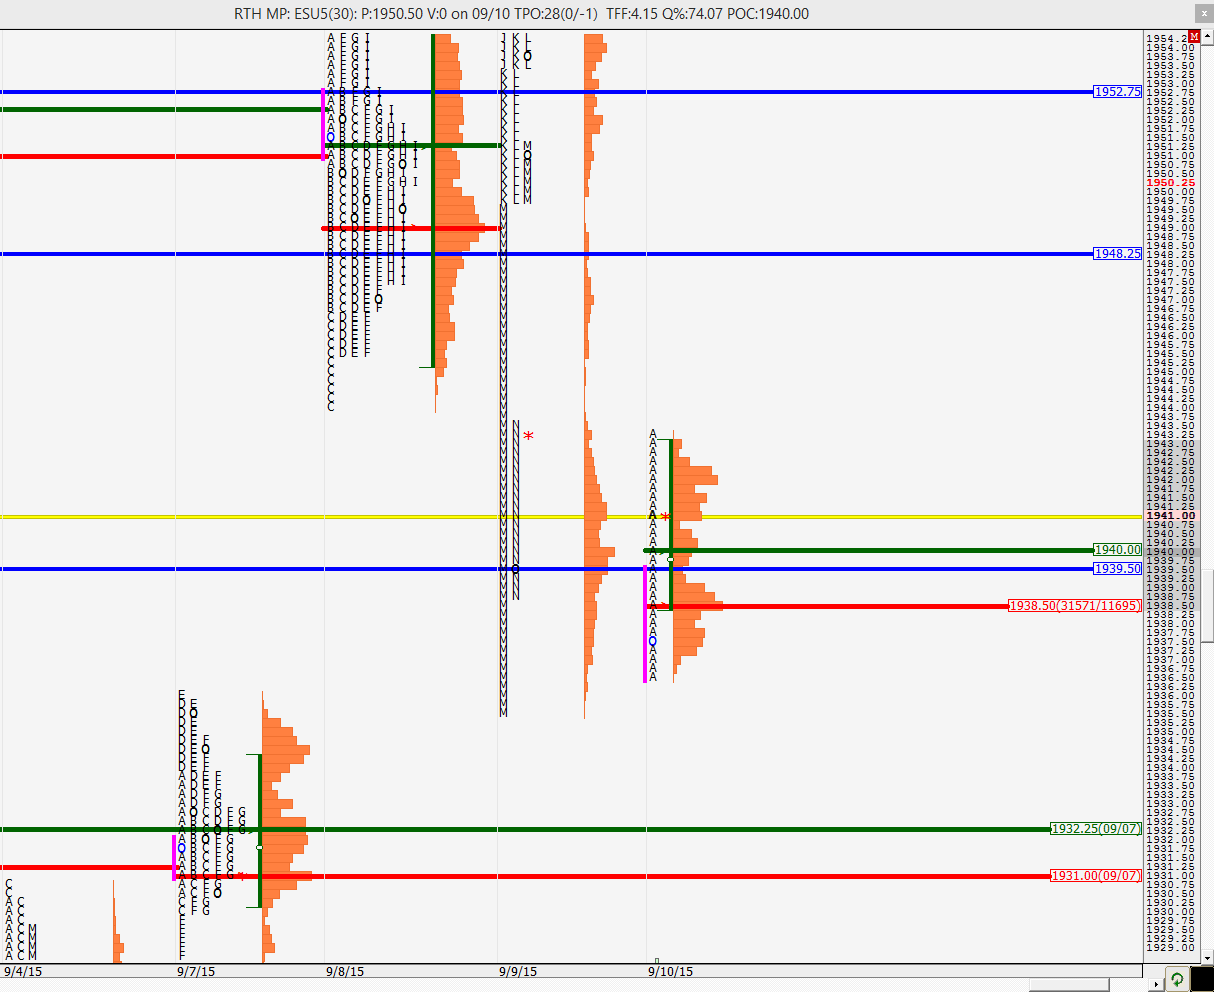
For the split profile, I would like to focus on the defense and subsequent surrender of Tuesday's highs. Looking at the chart below we can see how the buyers repeatedly tried to defend the highs in C, D, E, F and G periods. After so many tries when the market again came back, with the buyers not getting anything for their effort, they finally threw in the towel late in the H period and then it was a lot of liquidation with shorts piling on after that. This was a good example of how staying patient with a region pays off. One would have tried buying at the previous day's highs and would have gotten something at least out of it but after 2 plus hours of effort could not even get us to the A period low, the writing was on the wall and it was time to shift one's bias to the short side. This is when being flexible and patient pays off. I know I need to work on that.
We shall see how the O/N action plays out and come up with a plan in the morning. Remember the references mentioned earlier. Good luck to all.
Greenies: 1894, 1923.25, 1970, 1981, 1986, 1995, 2014.25, 2053.25, 2077.75
Click image for original size
Profile:
Due to the large range on the day, I had to really shrink the y-axis to see the entire day. We can see that the VPOC on the day was 1970, which is really far from the low and close of the day. We have been seeing that more often of late. Although it is hard to see on the chart, we had 4 distributions today i.e. regions separated by single prints. This is a lot and the odds of them getting cleaned up are high. We closed in the lowest distribution and the VPOC was in the second distribution from the top. Single prints from 1943.75 to 1949.5, 1960.5 to 1965.25 and 1977 to 1978.75. These are the single prints creating the distributions with the buying and selling tail at the extremes in addition to these.
Click image for original size
For the split profile, I would like to focus on the defense and subsequent surrender of Tuesday's highs. Looking at the chart below we can see how the buyers repeatedly tried to defend the highs in C, D, E, F and G periods. After so many tries when the market again came back, with the buyers not getting anything for their effort, they finally threw in the towel late in the H period and then it was a lot of liquidation with shorts piling on after that. This was a good example of how staying patient with a region pays off. One would have tried buying at the previous day's highs and would have gotten something at least out of it but after 2 plus hours of effort could not even get us to the A period low, the writing was on the wall and it was time to shift one's bias to the short side. This is when being flexible and patient pays off. I know I need to work on that.
Click image for original size
We shall see how the O/N action plays out and come up with a plan in the morning. Remember the references mentioned earlier. Good luck to all.
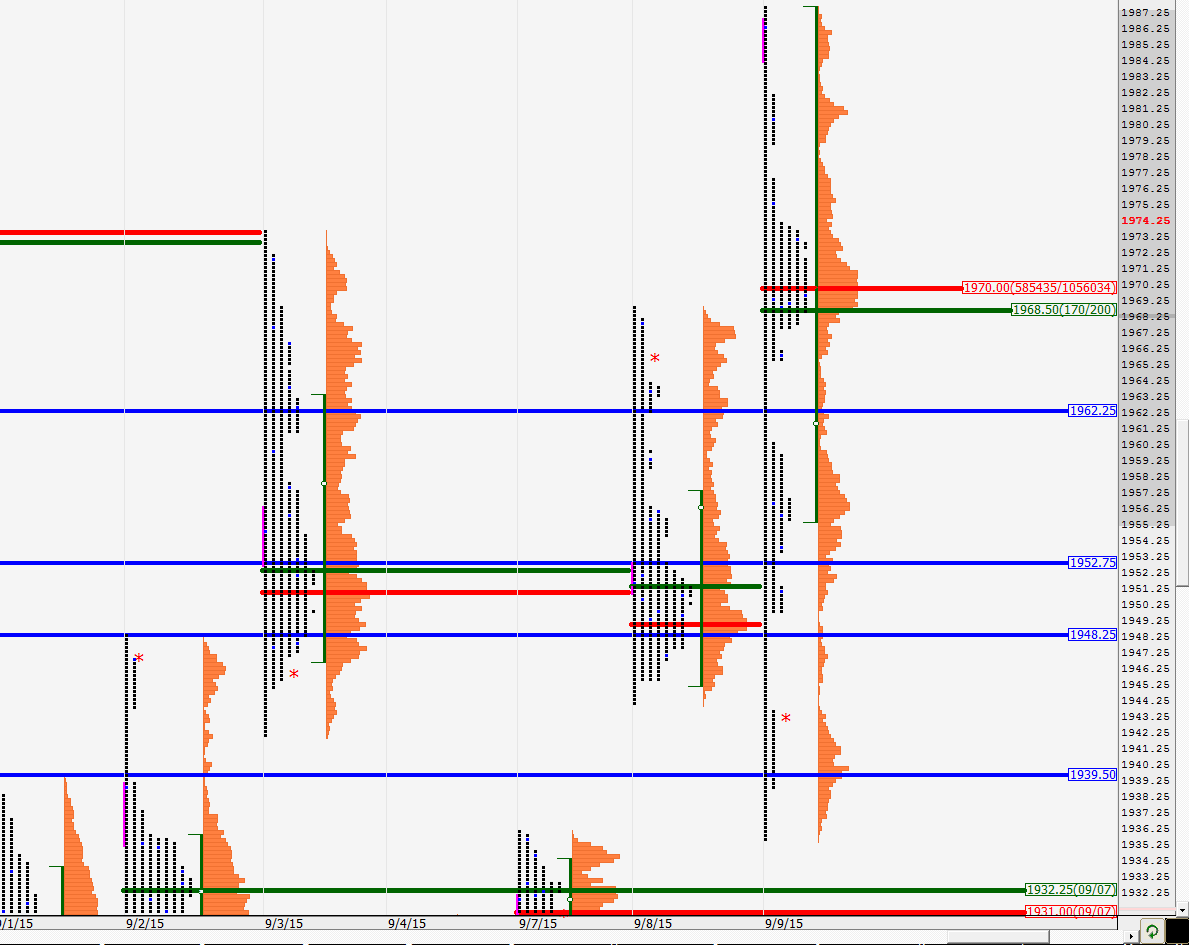
The O/N inventory looks more short than long but one could also say it is balanced. The ONL was right at the POC from 9/4 so that is going to be interesting to see if we manage to break through it or not. The ONH did not get to YD's VPOC and actually could not even get above the second lowest distribution. Keep watching those for possible turning points. The lines in the sand are there and now we see what happens. Good luck to all.
currently stopped right at the top of the lowest distribution. let us see if they can get through these singles
Click image for original size
the buying looks rather sick right now. buyers are not getting much for their effort so far
of course as soon as I say, they get paid! moving towards the second distribution from the bottom. the second distribution is rather wide with the next set of single prints starting at 1960.5
Originally posted by NewKid
the buying looks rather sick right now. buyers are not getting much for their effort so far
30 min VPOC at 1944.25
the fact that they could not even get to the second distribution does not bode well for buyers
very strong rejection of YD's RTH low
rejection from YD's VAL and the second distribution
another rejection from the VAL. If we manage to make new highs today then that 1970 VPOC is a magnet
current high of the day is right where the single prints stopped at 1965.25. Everything has been very mechanical today and that means it is just the day time frame traders playing. References are working great.
Emini Day Trading /
Daily Notes /
Forecast /
Economic Events /
Search /
Terms and Conditions /
Disclaimer /
Books /
Online Books /
Site Map /
Contact /
Privacy Policy /
Links /
About /
Day Trading Forum /
Investment Calculators /
Pivot Point Calculator /
Market Profile Generator /
Fibonacci Calculator /
Mailing List /
Advertise Here /
Articles /
Financial Terms /
Brokers /
Software /
Holidays /
Stock Split Calendar /
Mortgage Calculator /
Donate
Copyright © 2004-2023, MyPivots. All rights reserved.
Copyright © 2004-2023, MyPivots. All rights reserved.