ES Thursday 7-27-17
key zone 79.50 - 81.50 then 85 and 88 above if buyers really take over ...otherwise I think we will EVENTUALLY drift back to 75.50......keep 1/2 gap fill in mind too but we need to stay under 79.50 for that to come into play as with all our downside targets including the 77.50 that I am trying to use as a target....very well defined bell curve yesterday and On is net long but even so be careful of a valid upside breakout just in case....video explains the rest
scaling heavy at 77.50 first target
due to a poor fill after the push above overnight I was planning to use YD's highs as a first target but I didn't have much profit in the trade so waited for the 77.50 ledge point and va high
just covered runners at 76.50...done for today ...I don't like this area and there are too many numbers here for my taste
here is how my favorite chart looked...note left side and bulk of time at the 76.32 label....the software doesn't care that ES doesn't trade like that ...perfect hit on right side
Click image for original size
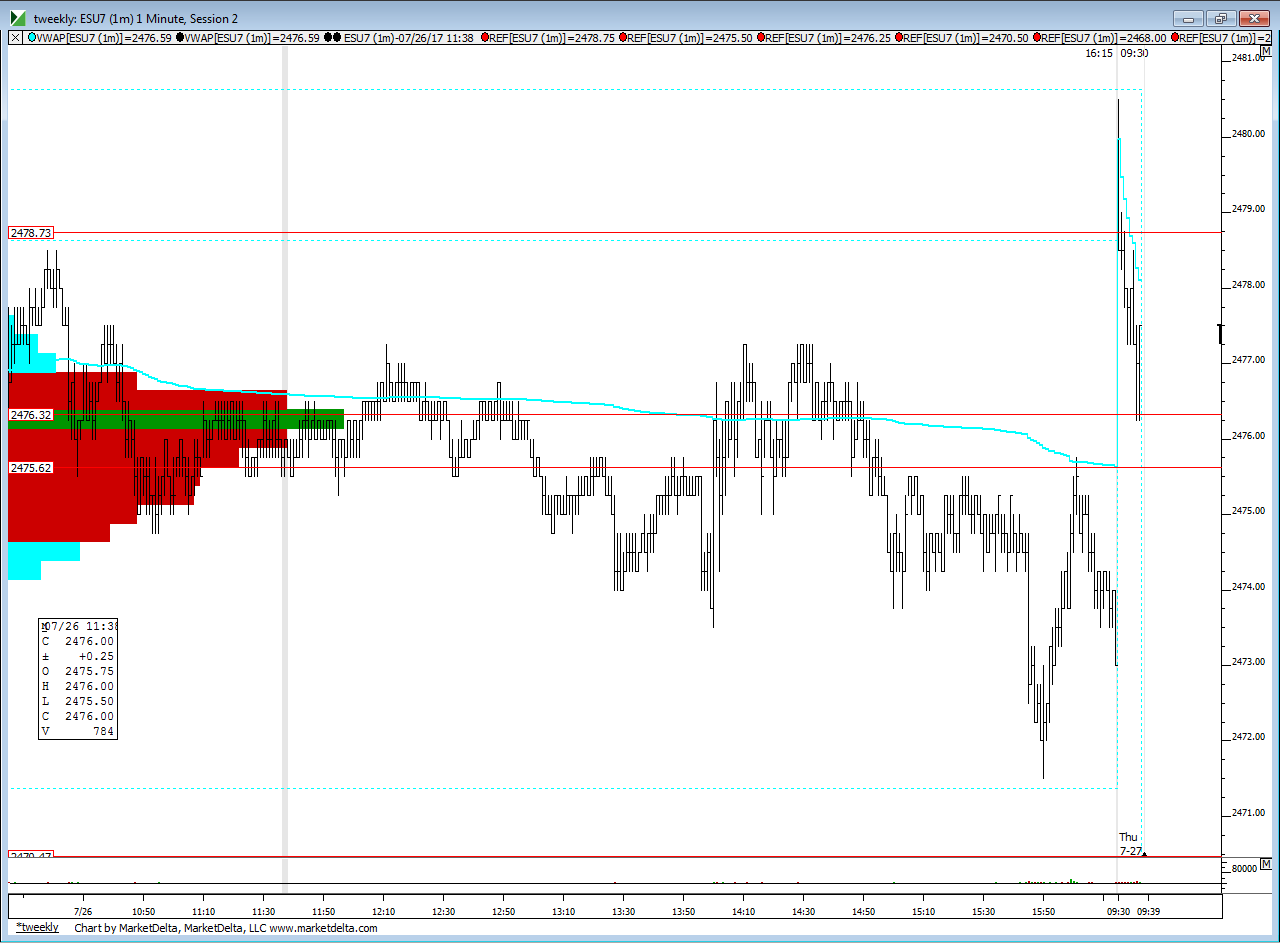
bottom line is that we have lost of numbers between 75.50 and 77.50
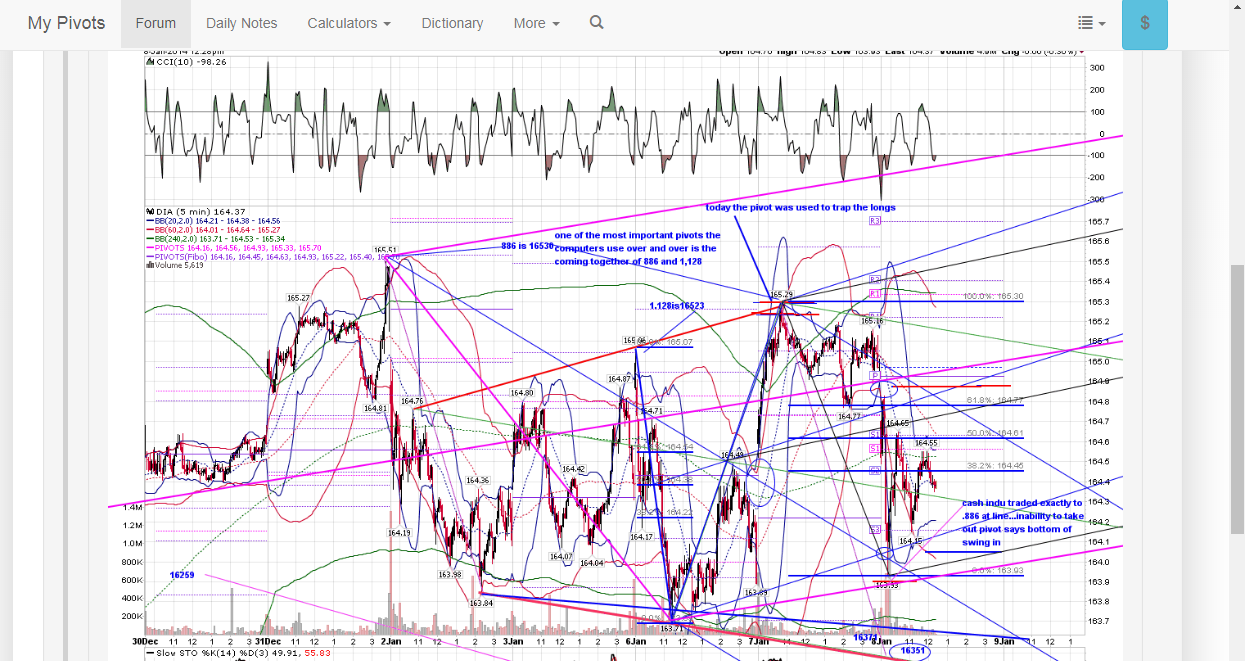
I found this on another thread from a while back....no need to mention whose it is but some people can make order from this kind of chaos....personally I find this kind of chart hysterical and they always mark them up after the fact.....I'm not bored and have no desire to combat anyone on this...I just couldn't help it today.........we have a poor low at yesterdays POC on our charts...I wonder what they would have?..........so here is a classic that I get a kick out of.....now it is true that I am making fun of this chart but I'm also bringing it to anyone's attention as there are tons of vendors promoting this stuff.......trouble is they never post the trades ahead of time or take ownership when they are wrong....that was and always will be my biggest problem with these folks......besides the fact that this kind of chart really hurts my eyes.........some real "Physical Graffiti" . I couldn't help the Zeppelin reference
I mean are ya kidding me ? what is this ? this is a real chart from our forum .......it scares me.....!
Click image for original size
I mean are ya kidding me ? what is this ? this is a real chart from our forum .......it scares me.....!
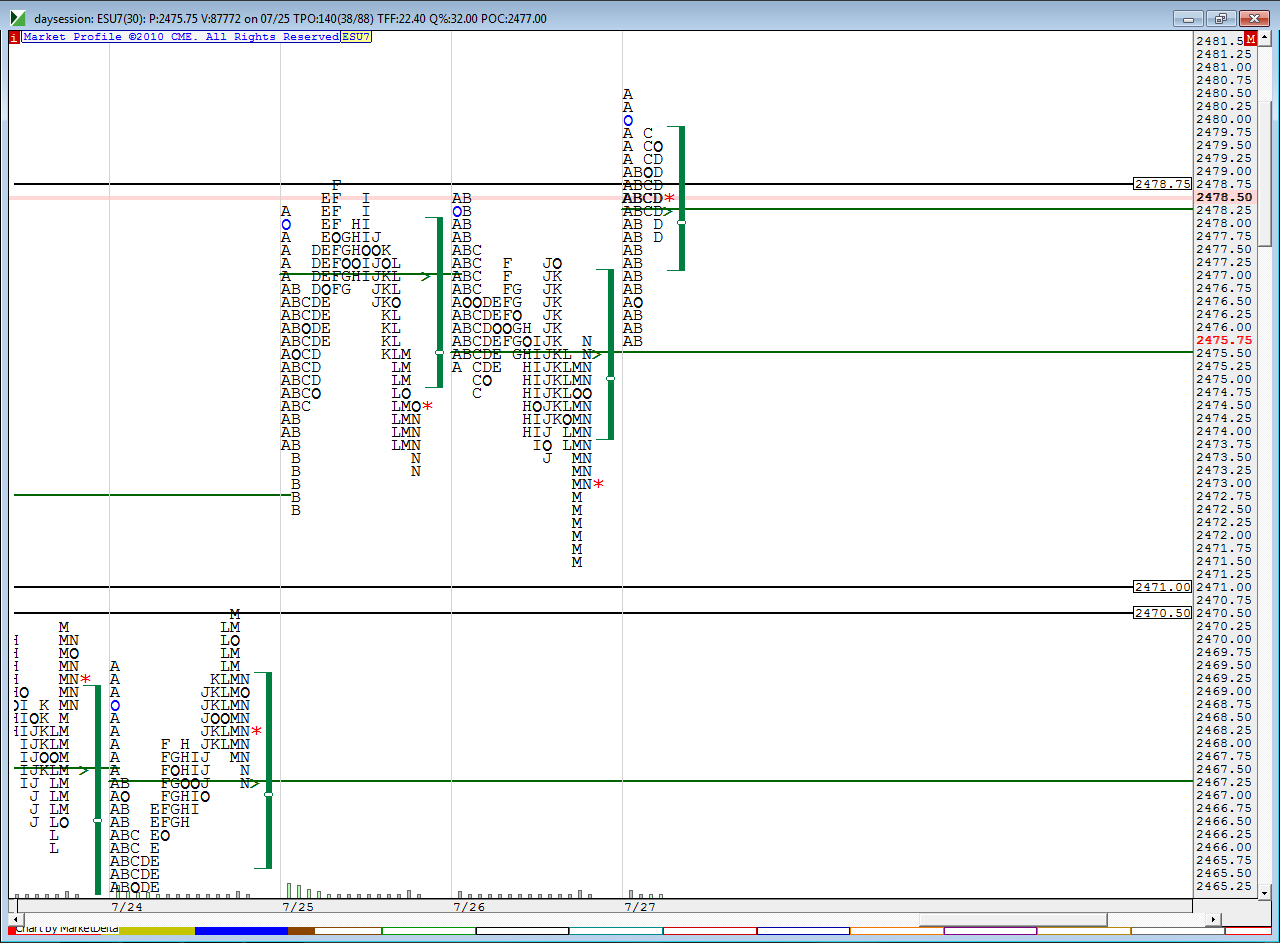
here is the poor low on our charts ..the matching lows at "A" and "B" period up against yd's POC.....it's easy to see for me but some would probably think looking at the letters is just as confusing
Click image for original size
ALERT - be careful down here....
my option trade that I just closed out....just a risk graph on video for anyone new to options etc
Be wary of that rain Bruce
Thanks for the videos...videos in the afternoon for 5k a month...a deal at twice the price :-)
Thanks for the videos...videos in the afternoon for 5k a month...a deal at twice the price :-)
some comments about value on weekly and going over some of those pdf setups from two weeks ago...price on a weekly level seems to have run a bit too far away from value( this weeks devopeing poc)...they may need to build tpo's in the 65 - 67 area now
Emini Day Trading /
Daily Notes /
Forecast /
Economic Events /
Search /
Terms and Conditions /
Disclaimer /
Books /
Online Books /
Site Map /
Contact /
Privacy Policy /
Links /
About /
Day Trading Forum /
Investment Calculators /
Pivot Point Calculator /
Market Profile Generator /
Fibonacci Calculator /
Mailing List /
Advertise Here /
Articles /
Financial Terms /
Brokers /
Software /
Holidays /
Stock Split Calendar /
Mortgage Calculator /
Donate
Copyright © 2004-2023, MyPivots. All rights reserved.
Copyright © 2004-2023, MyPivots. All rights reserved.