Starting it off.
Al
MA
MarcinO
Rep: 67
Posts: 5,506
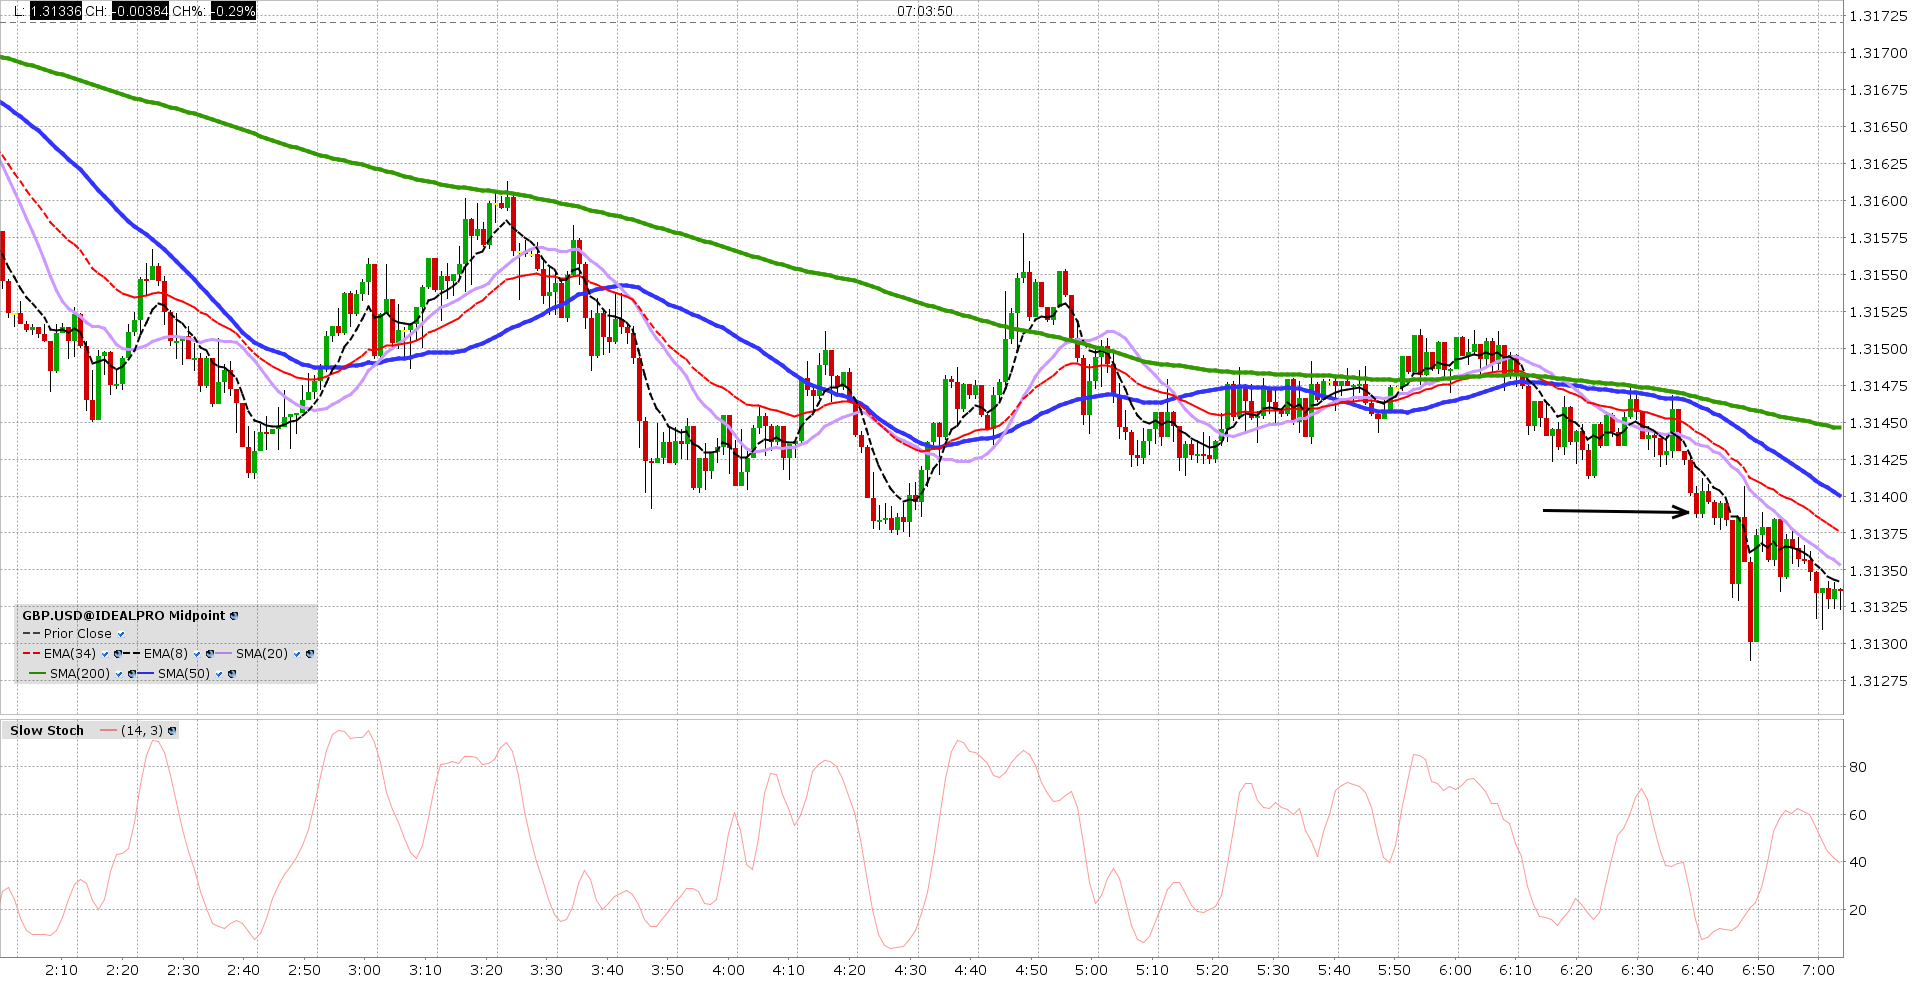
Ok. I know you are limited to trading hours resulting from your geographical zone, but what you can do, even in this realtively poor trading day, is try to catch a pullback in a trend, instead of breaking below previous low. Entries about 5:35, 6:10 or 6:35 (time from your chart) would all be legitimate.
When a trend is confirmed on your trading time frame, what you need to catch it is a pullback, followed by price stabilization and some small reaction in trend direction, which gives you way better risk:reward ratio than waiting for making new low for the move.
Of course you have to consider context, areas etc. but this is basically what you do, to increase your statistical chances.
Originally posted by albert
Marcin,
Closer to entry.
Al
AL
albert
Rep: 99
Posts: 3,094
Marcin,
Thank you for the kind words. Your comments all make sense. I probably make things too complicated with all my moving averages and indicators. In addition, I think I am looking and waiting for too much trend confirmation, when there is no clear 50 x 200 moving average crossover nearby, as was so this morning on the GBP.USD 1 minute.. I need to watch the price - 200 sma touches and reversals more closely, I think. I am really interested in increasing my statistical chances.
Thanks for taking the time to explain that to me, Sorry I was not more prompt in my response to you.
Good Trading,
Al :--)
Originally posted by MarcinO
Ok. I know you are limited to trading hours resulting from your geographical zone, but what you can do, even in this realtively poor trading day, is try to catch a pullback in a trend, instead of breaking below previous low. Entries about 5:35, 6:10 or 6:35 (time from your chart) would all be legitimate.
When a trend is confirmed on your trading time frame, what you need to catch it is a pullback, followed by price stabilization and some small reaction in trend direction, which gives you way better risk:reward ratio than waiting for making new low for the move.
Of course you have to consider context, areas etc. but this is basically what you do, to increase your statistical chances.
Originally posted by albert
Marcin,
Closer to entry.
Al
AL
albert
Rep: 99
Posts: 3,094
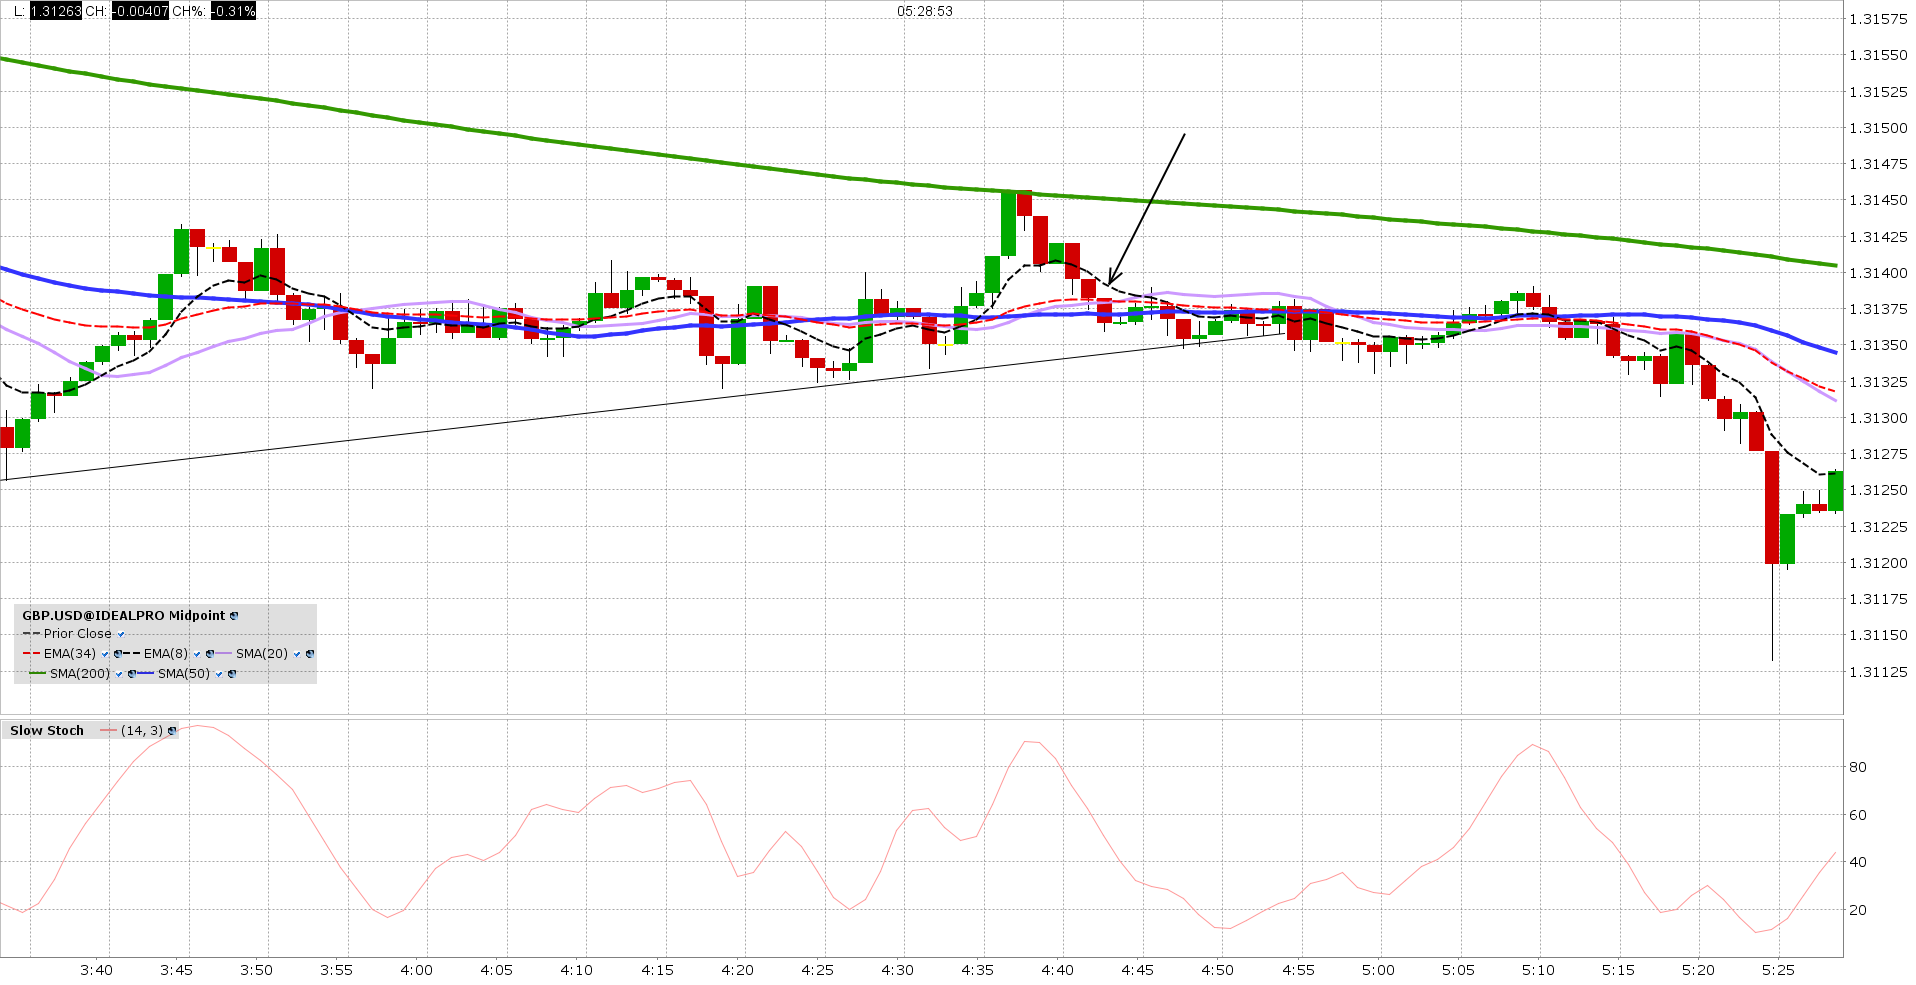
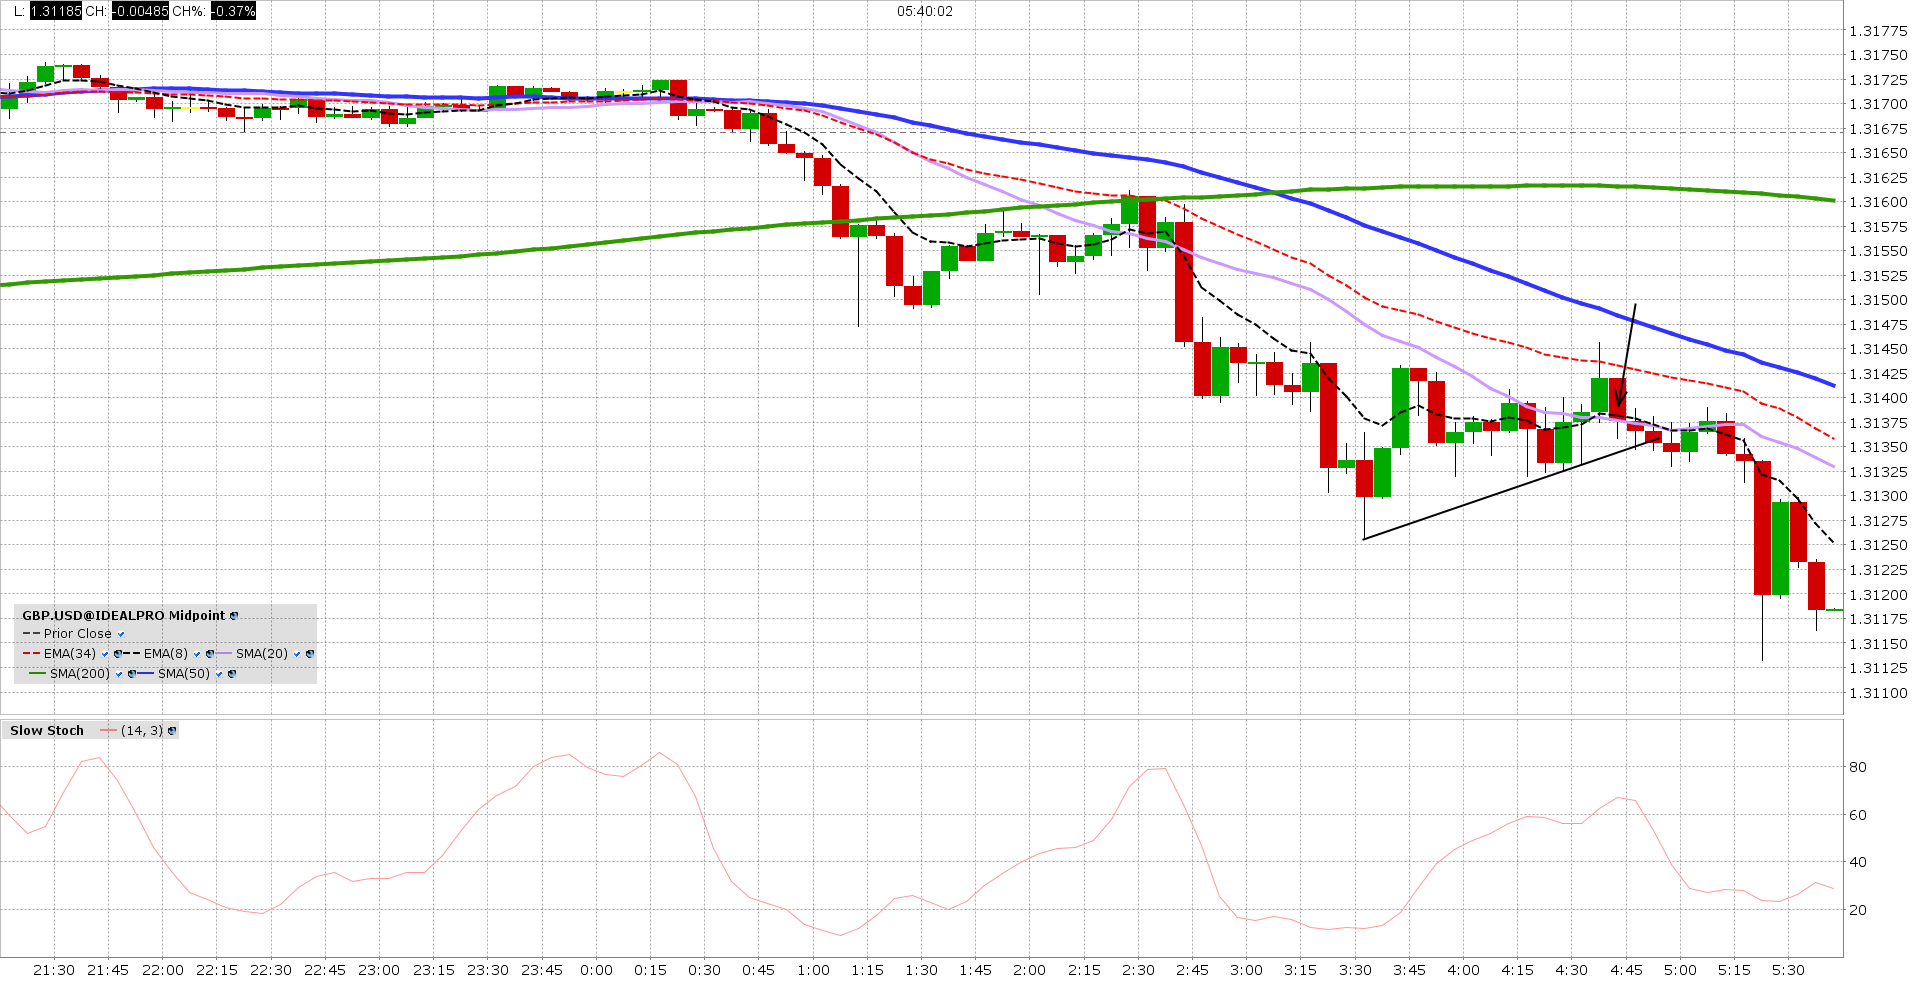
OK. I listened to Marcin and simplified things. Made almost 20 pips selling GBP.USD in a downtrend. This time I woke up earlier, sold nearer a 200 price reversal on the GBP.USD 1 min . The scissors top reversal at 4:42 EST - 5 m chart - was key for me. Thank you, Marcin. This is progress.
Thanks to rat also, and all the Kane crew for sharing their expertise!
Al :--)
Thanks to rat also, and all the Kane crew for sharing their expertise!
Click image for original size
Click image for original size
Al :--)
AL
albert
Rep: 99
Posts: 3,094
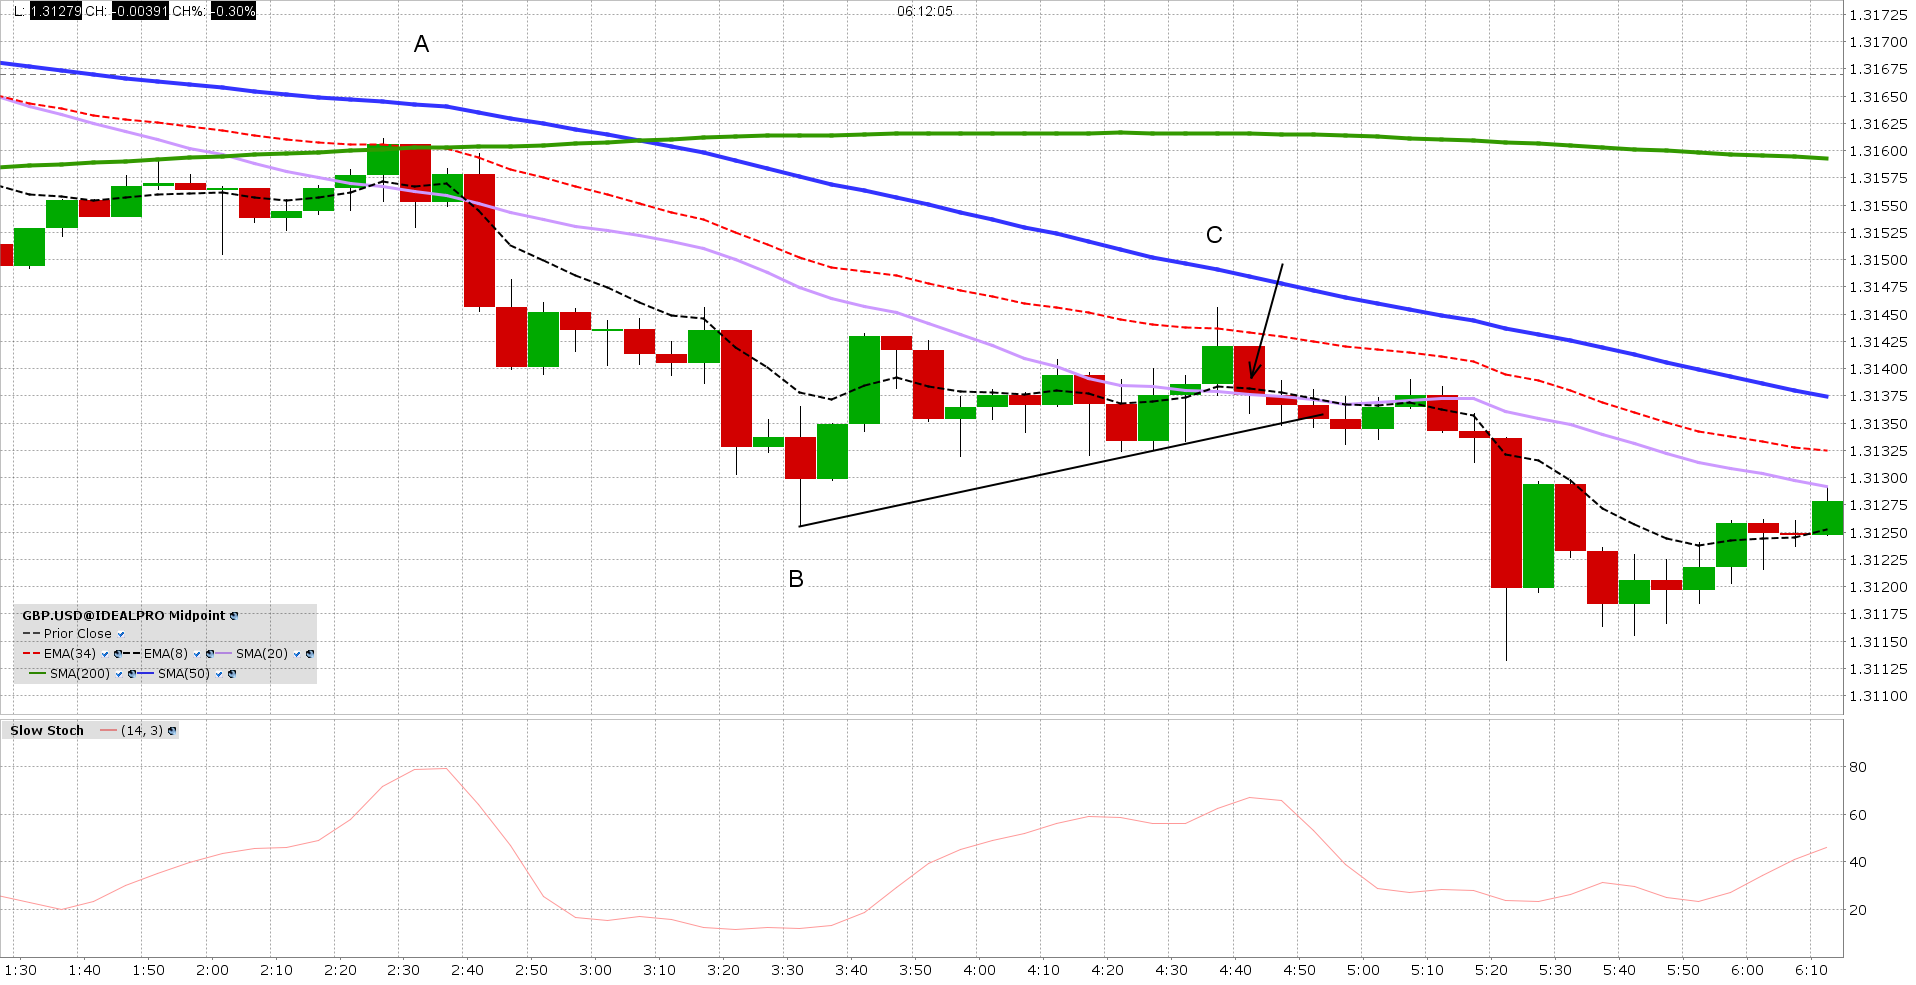
Fibo for ABC on 5 min chart is 0.564 and timewise is 1.000 from A to B and B to C.
Al :--)
Click image for original size
Al :--)
AL
albert
Rep: 99
Posts: 3,094
I wrote "scissors top" when I meant "Tweezers Top." Sorry about that,
Al
Al
Originally posted by albert
OK. I listened to Marcin and simplified things. Made almost 20 pips selling GBP.USD in a downtrend. This time I woke up earlier, sold nearer a 200 price reversal on the GBP.USD 1 min . The scissors top reversal at 4:42 EST - 5 m chart - was key for me. Thank you, Marcin. This is progress.
Thanks to rat also, and all the Kane crew for sharing their expertise!
Click image for original size
Click image for original size
Al :--)
AL
albert
Rep: 99
Posts: 3,094
Originally posted by rat89
yeah, your B looks like a (1) and your C looks like a (2). Next move up looks like a wave 3
rat, I appreciate your comments! Al
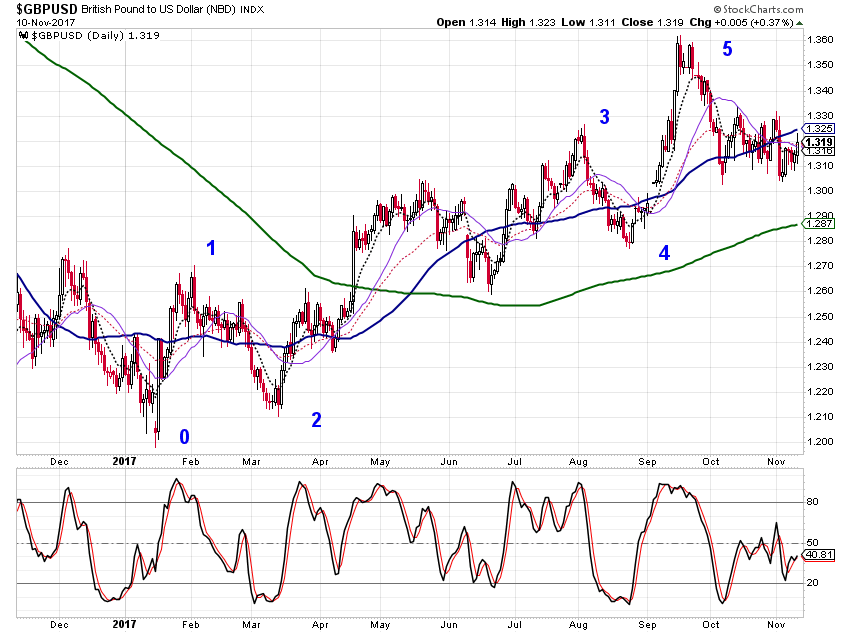
Work in progress. If this wave count is correct, then IMO GBP.USD is now in a corrective mode, and I have not analyzed that yet. I think it is an ABC correction in the form of a five step Wave A, a 3 step Wave B, and a 5 step Wave C. I will post that later.
Click image for original size
Al