Starting it off.
Al
AL
albert
Rep: 99
Posts: 3,094
And thank you, Marcin!
Al
:--)
Al
:--)
Originally posted by MarcinO
Nice work with shorting Cable, Al!
RA
rat89
Rep: 0
Posts: 7,015
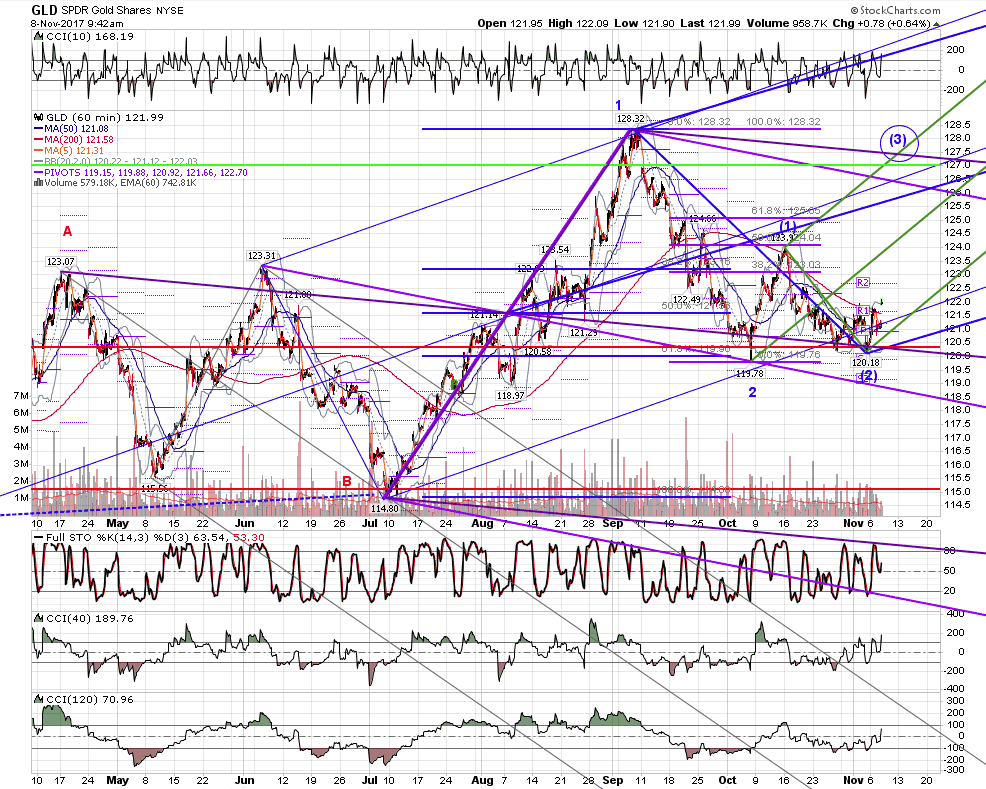
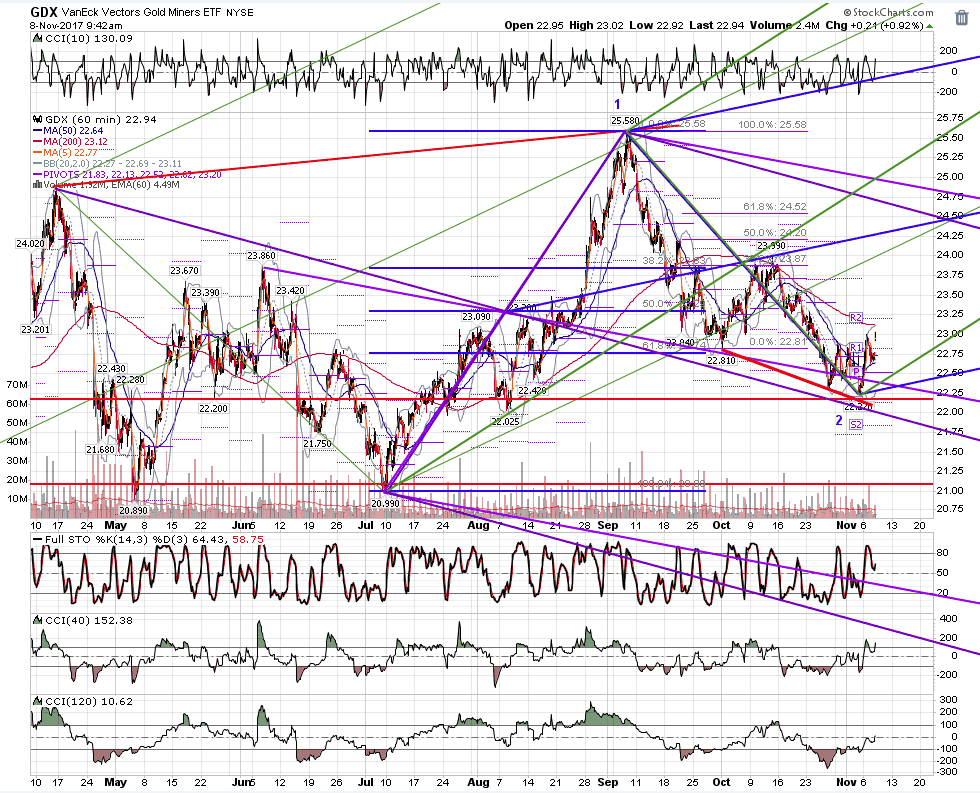
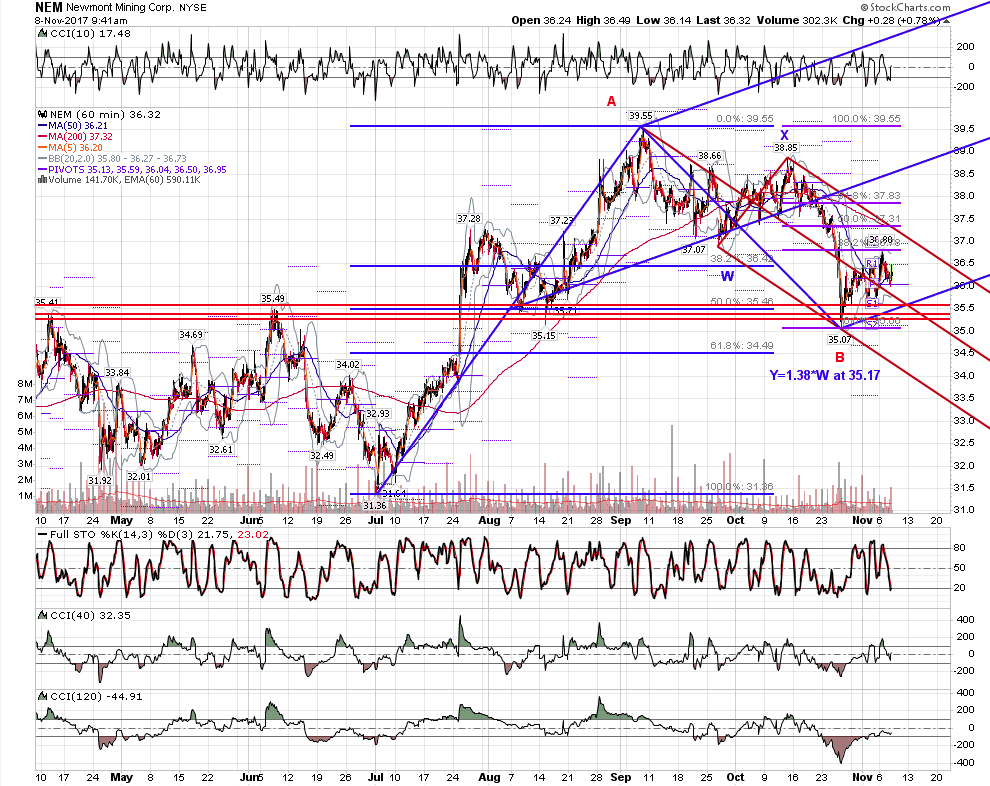
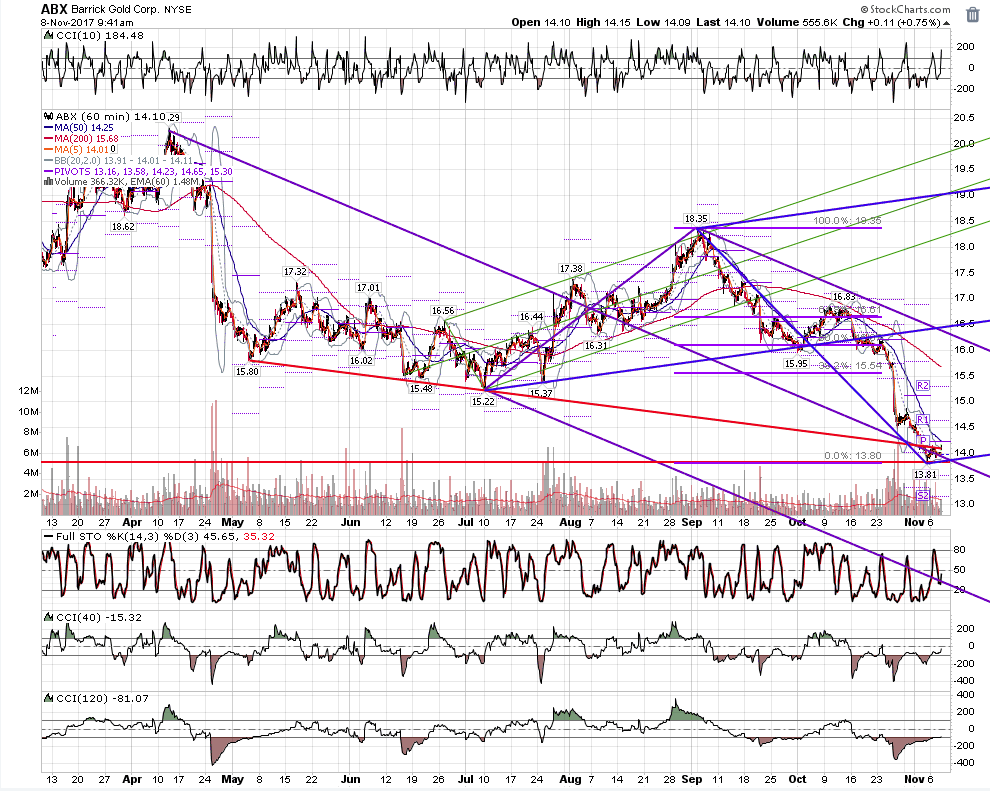
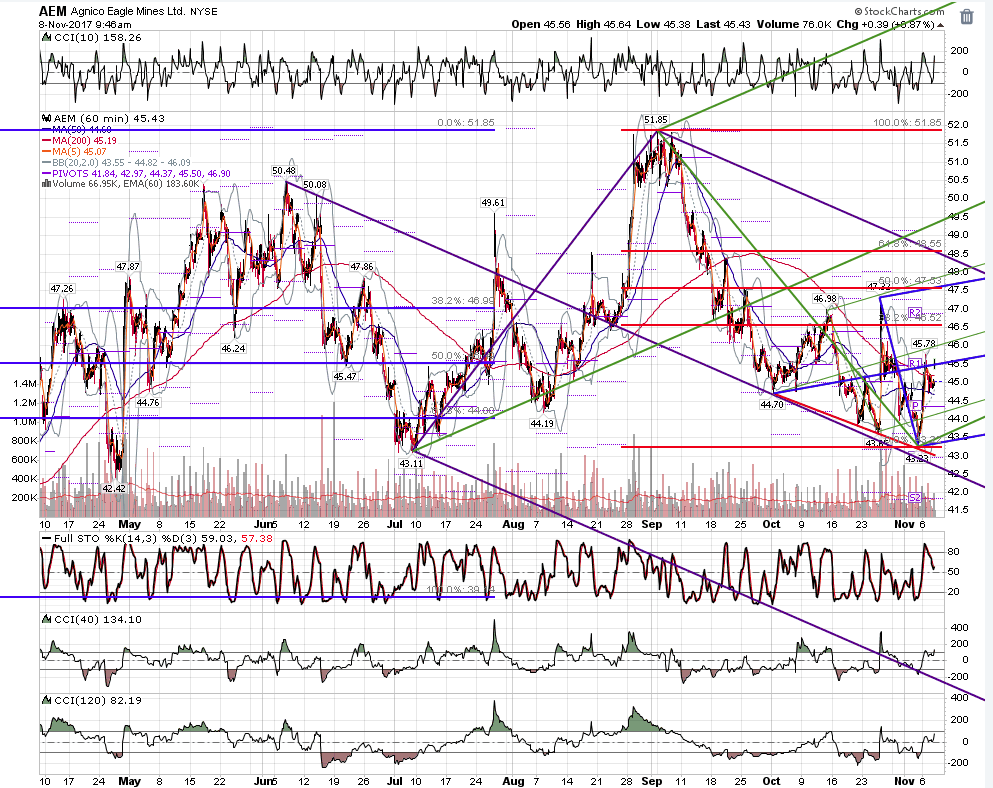
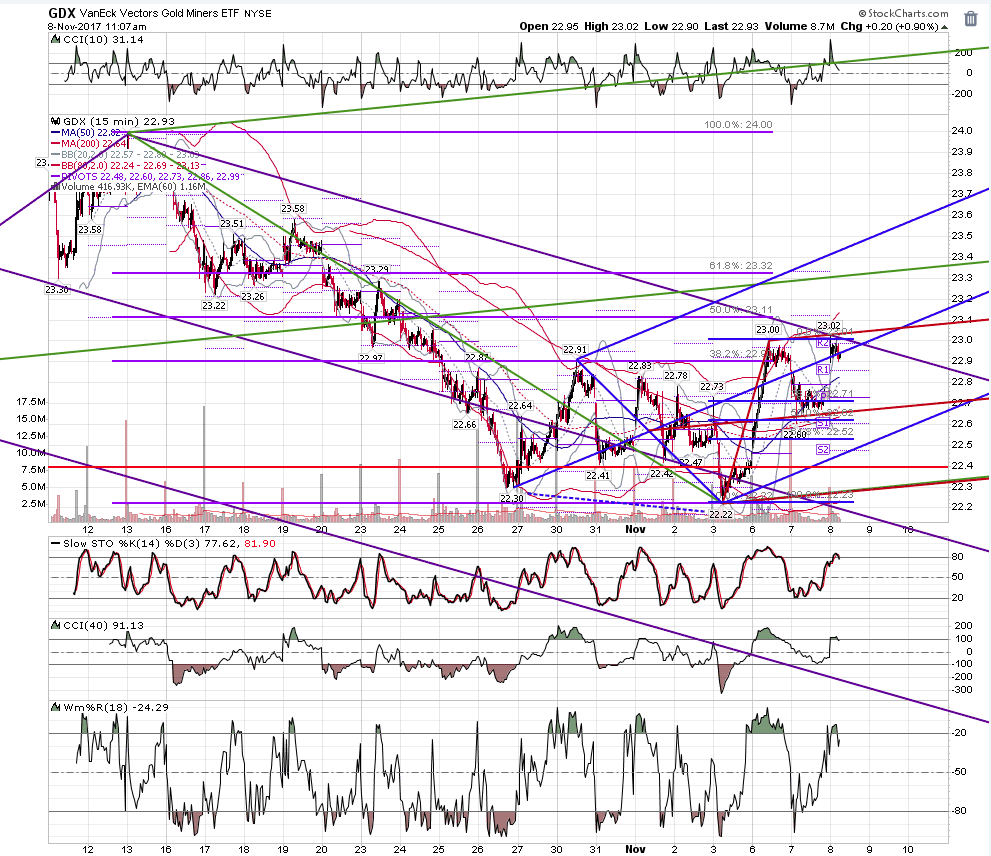
gld, gdx, nem, abx, aem 60. Break the Friday lows and there is a lot of air below. Hold them and there are some tantalizing upside targets.
Click image for original size
Click image for original size
Click image for original size
Click image for original size
Click image for original size
RA
rat89
Rep: 0
Posts: 7,015
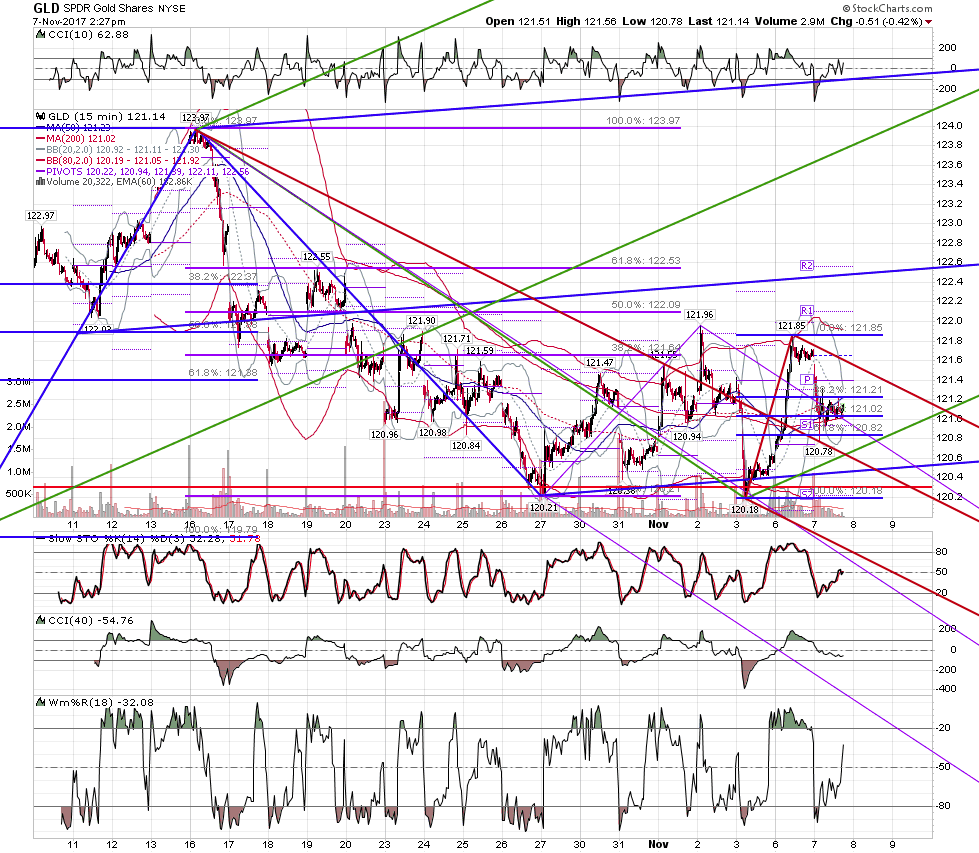
this is what gld did yesterday: right to the .618 at the red median line. Perfect for a minute wave 2 of minor (3)
Click image for original size
RA
rat89
Rep: 0
Posts: 7,015
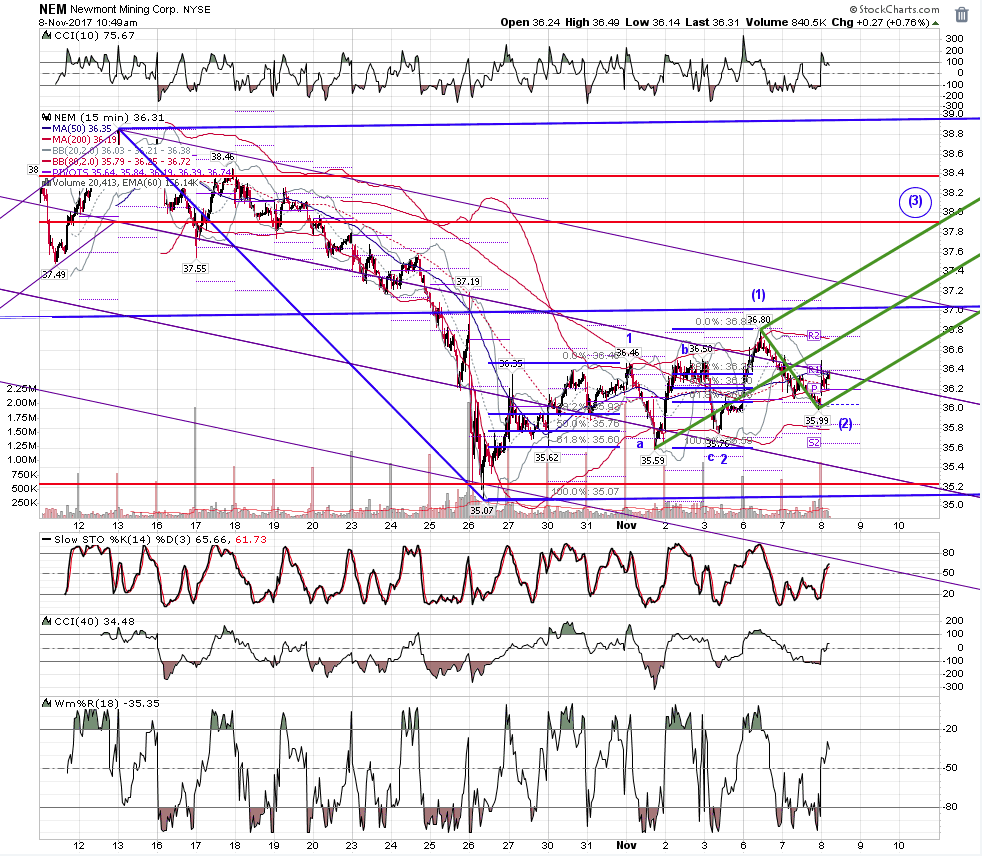
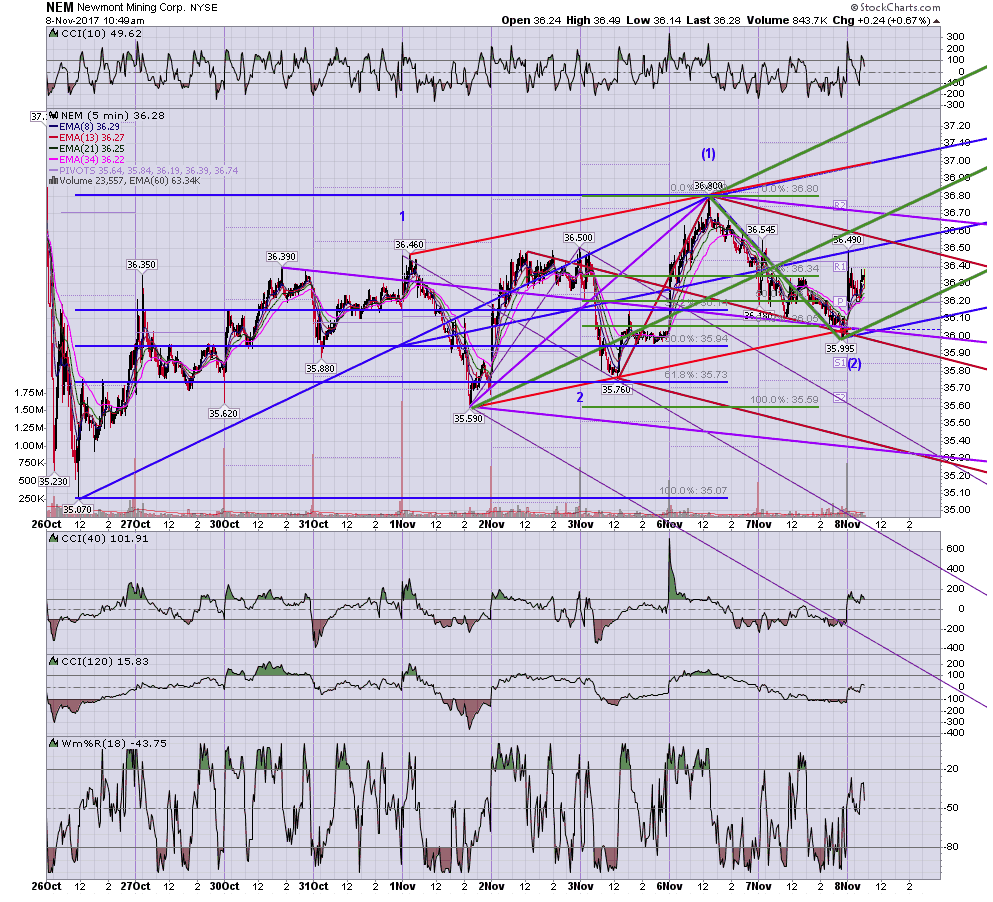
meanwhile: nem 5 and 15 - the difference between gdx and nem has been bothering me. Assuming they are in the process of starting an impulsive move up (humor me here) based on the key lows put in Friday, gld and gdx look to be in minor 3 up whereas nem appears to be either in minor 5 OR C of an ABC up. That' on the 60 minute (shown below). But on the 15 minute gdx and nem look really different. Nem appears to be a mess, bouncing around, looking like a good old bear flag - maybe it's a handle? ;). Think about the fact that a wave 2 will typically retrace .618 - .786 of wave 1, can retrace all of wave 1, and serves the purpose of causing great doubt as to the primary direction before an impulsive move for wave 3 launches. Wave 2 can be short and swift, or an abc. Here is nem, in all its glory, with a potential that minor 1 ended at 36.46, minor 2 was an abc down to .618 at 35.59. It's tricky, because b took out minor 1 high by 4¢, and a was lower than c. However, c roughly = a. Then wave (1) of minor 3 headed up to 36.80 and fell had in a wave (2) to 35.99, again at .618. IF this count is correct, wave (3) of minor 3 targets 37.95 area. Sounds like a bunch of mumbo jumbo if all you want to do is play pattern trades or follow a trend. The pattern here looks yucky and there appears to be no trend. It's a perfect setup for something.
Gdx 15:
Click image for original size
Click image for original size
Gdx 15:
Click image for original size
RA
rat89
Rep: 0
Posts: 7,015
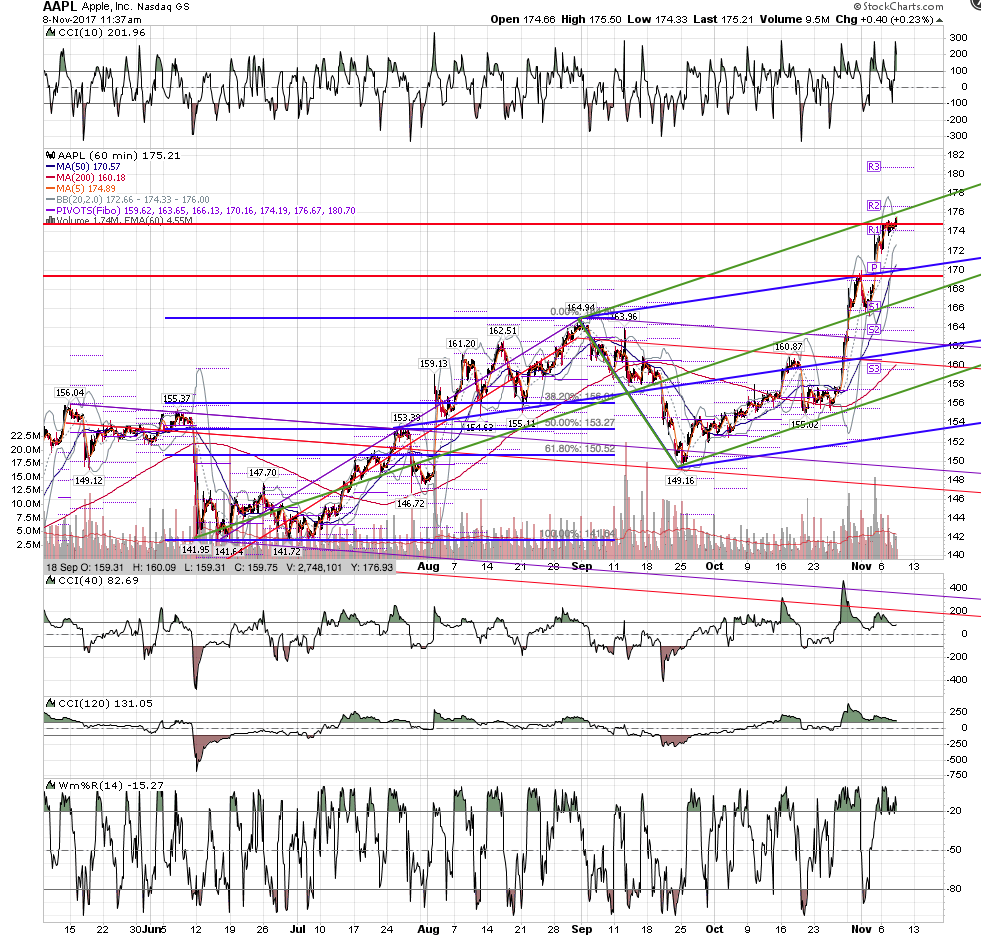
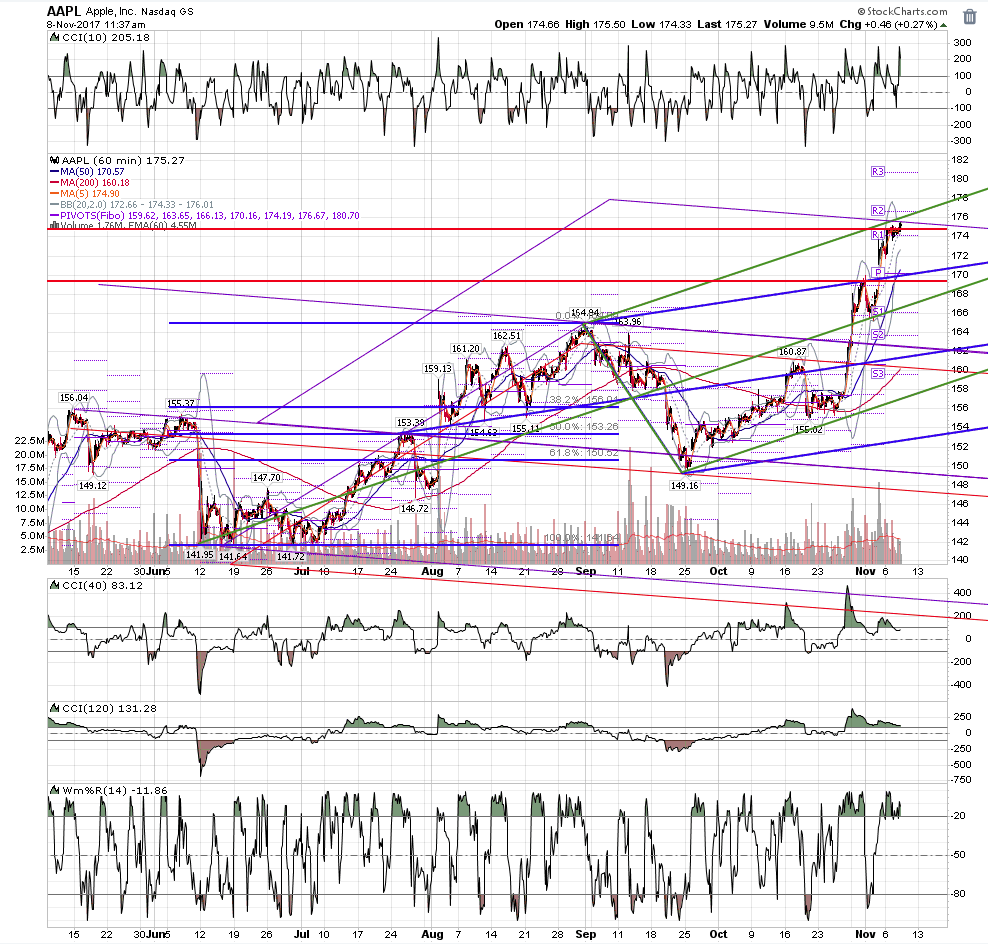
aapl 60 - jumped up and over the upper line of the blue modified schiff median line set (more conservative move indicated) and is now playing with the upper line of the standard green set, anchored at the earliest low of the series of lows in June. What's really interesting is that if you take the bear set (thin purple set whose median line was hit at the September low at 149.16) double it, and move it up as a sliding parallel, the upper line is here in the same area.
164.94 - 149.16 = 1.618 at 174.69
175.25 - 174.02 (yesterday) = 1.27 at 175.58
164.94 - 149.16 = 1.618 at 174.69
175.25 - 174.02 (yesterday) = 1.27 at 175.58
Click image for original size
Click image for original size
RA
rat89
Rep: 0
Posts: 7,015
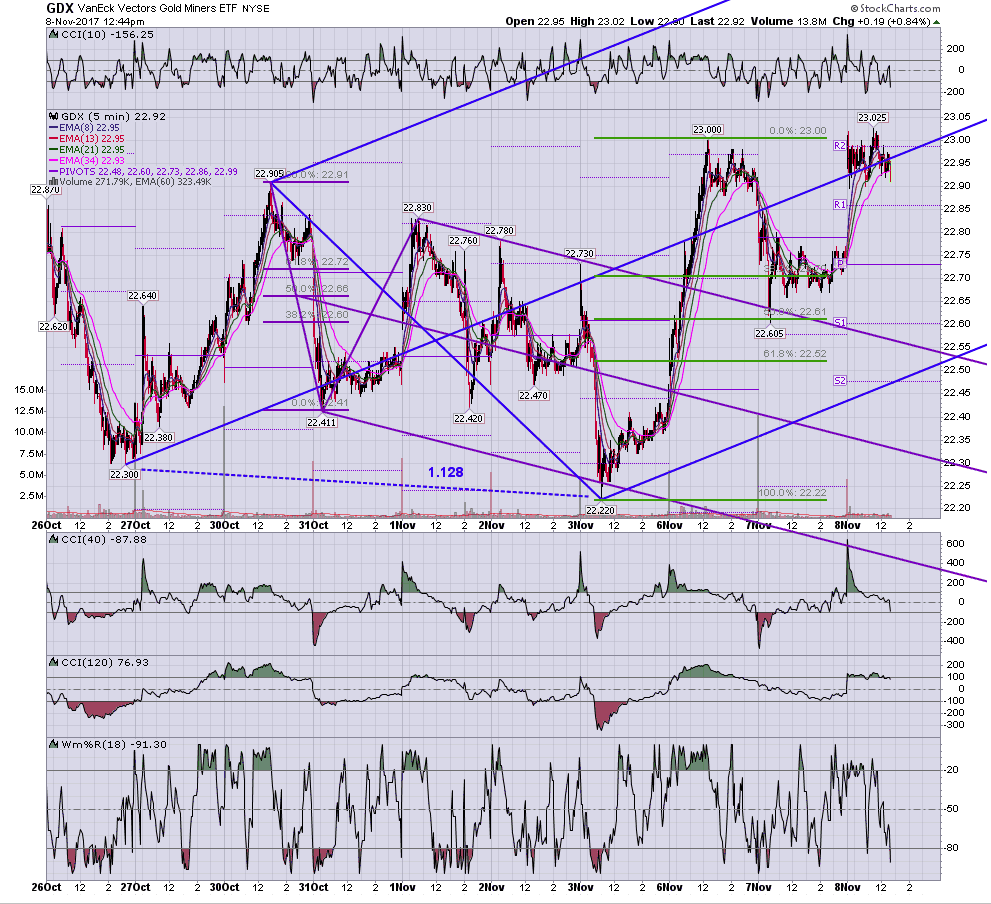
gdx 5 - we know the power of the 1.27 and the 1.128, the inverse of .886 :
Click image for original size
AL
albert
Rep: 99
Posts: 3,094
rat,
Awesome work and analysis, all of it. I do not pretend to understand it, but I will study it further. I am hoping that NEM and gold prices resolve to the upside by the end of the week.
Al :--)
Awesome work and analysis, all of it. I do not pretend to understand it, but I will study it further. I am hoping that NEM and gold prices resolve to the upside by the end of the week.
Al :--)
Originally posted by rat89
meanwhile: nem 5 and 15 - the difference between gdx and nem has been bothering me. Assuming they are in the process of starting an impulsive move up (humor me here) based on the key lows put in Friday, gld and gdx look to be in minor 3 up whereas nem appears to be either in minor 5 OR C of an ABC up. That' on the 60 minute (shown below). But on the 15 minute gdx and nem look really different. Nem appears to be a mess, bouncing around, looking like a good old bear flag - maybe it's a handle? ;). Think about the fact that a wave 2 will typically retrace .618 - .786 of wave 1, can retrace all of wave 1, and serves the purpose of causing great doubt as to the primary direction before an impulsive move for wave 3 launches. Wave 2 can be short and swift, or an abc. Here is nem, in all its glory, with a potential that minor 1 ended at 36.46, minor 2 was an abc down to .618 at 35.59. It's tricky, because b took out minor 1 high by 4¢, and a was lower than c. However, c roughly = a. Then wave (1) of minor 3 headed up to 36.80 and fell had in a wave (2) to 35.99, again at .618. IF this count is correct, wave (3) of minor 3 targets 37.95 area. Sounds like a bunch of mumbo jumbo if all you want to do is play pattern trades or follow a trend. The pattern here looks yucky and there appears to be no trend. It's a perfect setup for something.
Click image for original size
Click image for original size
Gdx 15:
Click image for original size
MA
MarcinO
Rep: 67
Posts: 5,506
Wow, that's an analysis, rat!
I do not know NEM, neither follow it, but using my gut feeling and typical behaviour of a few instruments I know, I wouldn't be surpised if it moved up a bit, retracing more than a half of the last leg down (with a starting point marked as (1) ) you shown on M15, and made a new low.
That's just WAG, but why not have some fun in here?
Originally posted by rat89
meanwhile: nem 5 and 15 - the difference between gdx and nem has been bothering me. Assuming they are in the process of starting an impulsive move up (humor me here) based on the key lows put in Friday, gld and gdx look to be in minor 3 up whereas nem appears to be either in minor 5 OR C of an ABC up. That' on the 60 minute (shown below). But on the 15 minute gdx and nem look really different. Nem appears to be a mess, bouncing around, looking like a good old bear flag - maybe it's a handle? ;). Think about the fact that a wave 2 will typically retrace .618 - .786 of wave 1, can retrace all of wave 1, and serves the purpose of causing great doubt as to the primary direction before an impulsive move for wave 3 launches. Wave 2 can be short and swift, or an abc. Here is nem, in all its glory, with a potential that minor 1 ended at 36.46, minor 2 was an abc down to .618 at 35.59. It's tricky, because b took out minor 1 high by 4¢, and a was lower than c. However, c roughly = a. Then wave (1) of minor 3 headed up to 36.80 and fell had in a wave (2) to 35.99, again at .618. IF this count is correct, wave (3) of minor 3 targets 37.95 area. Sounds like a bunch of mumbo jumbo if all you want to do is play pattern trades or follow a trend. The pattern here looks yucky and there appears to be no trend. It's a perfect setup for something.
Click image for original size
AL
albert
Rep: 99
Posts: 3,094
Originally posted by rat89
yeah, your B looks like a (1) and your C looks like a (2). Next move up looks like a wave 3
rat, I appreciate your comments! Al
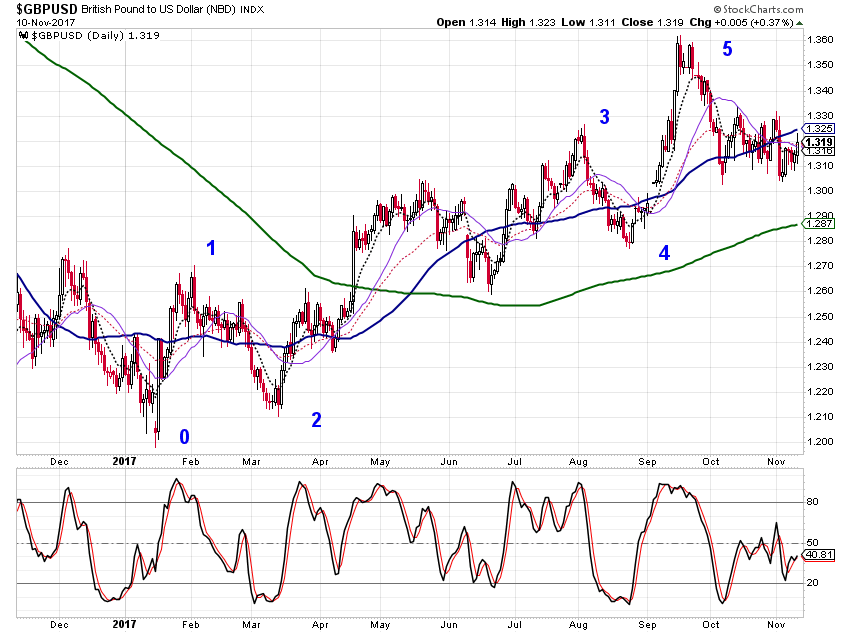
Work in progress. If this wave count is correct, then IMO GBP.USD is now in a corrective mode, and I have not analyzed that yet. I think it is an ABC correction in the form of a five step Wave A, a 3 step Wave B, and a 5 step Wave C. I will post that later.
Click image for original size
Al