MyPivots
Sign In
DU
Duane
Rep: 100
Posts: 1,095
Hey Al, I thought that I would give you a break this week. Your diligence is certainly an asset that we all benefit from!

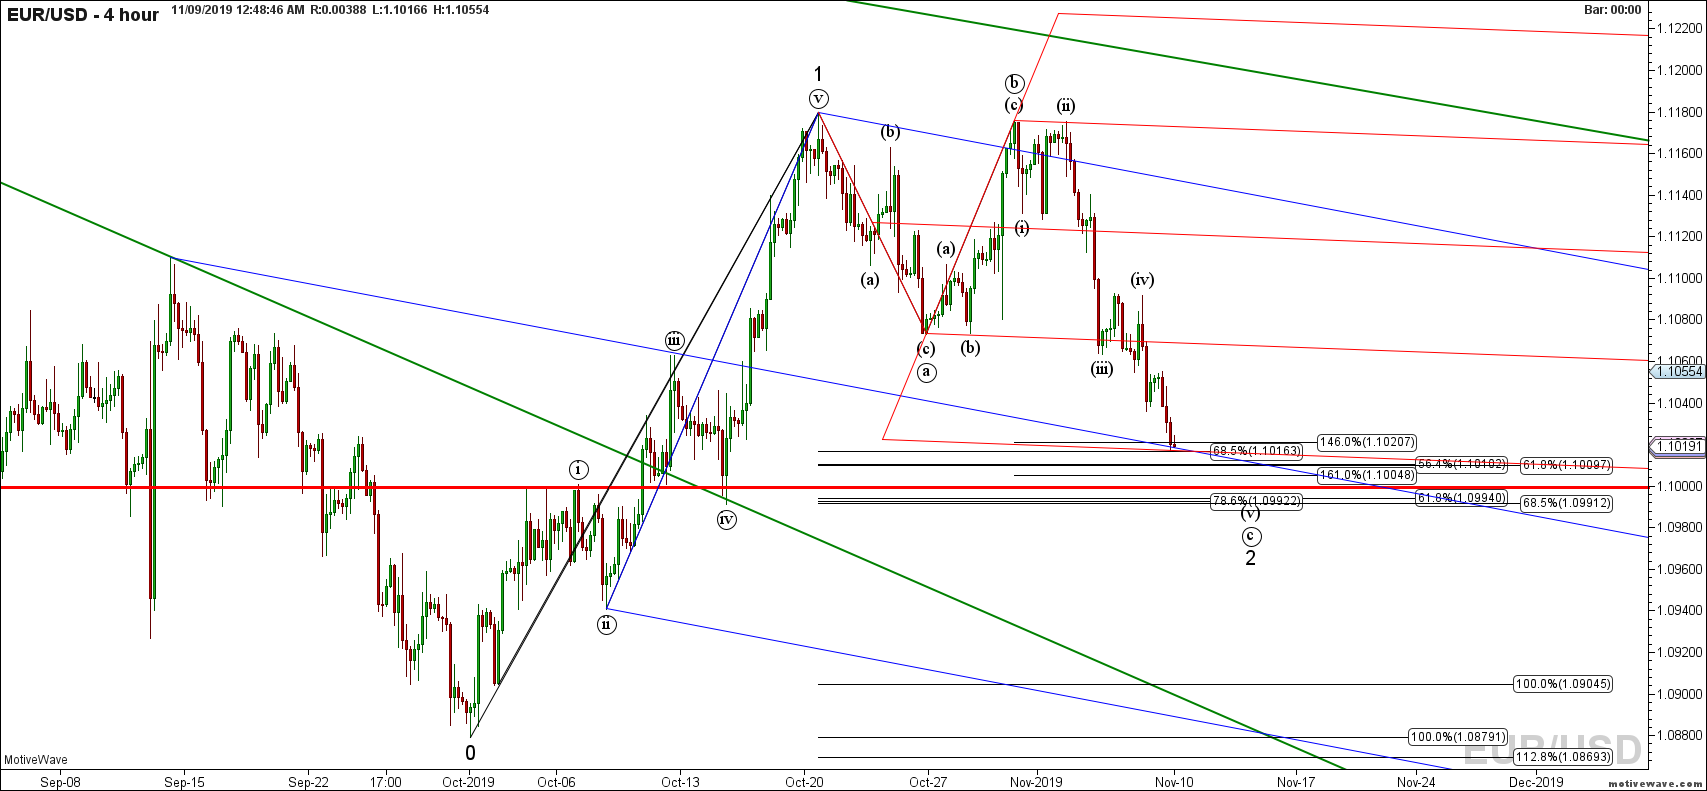
It's Friday night, and I have entered this EURUSD position against my trading plan, ( no trigger ) . And I know that I am going to take some heat because of it. After all the Market is the best teacher. I thought that 146.0 ext plus the lines would be a great place to enter, but alas, the price action is still bearish. This is a classic Double top ABCD, so if not 146.0 the next stop is 161.0 So where are the lines?

Lets start from the beginning. Down trend with break and retest of down trend line.

Click image for original size
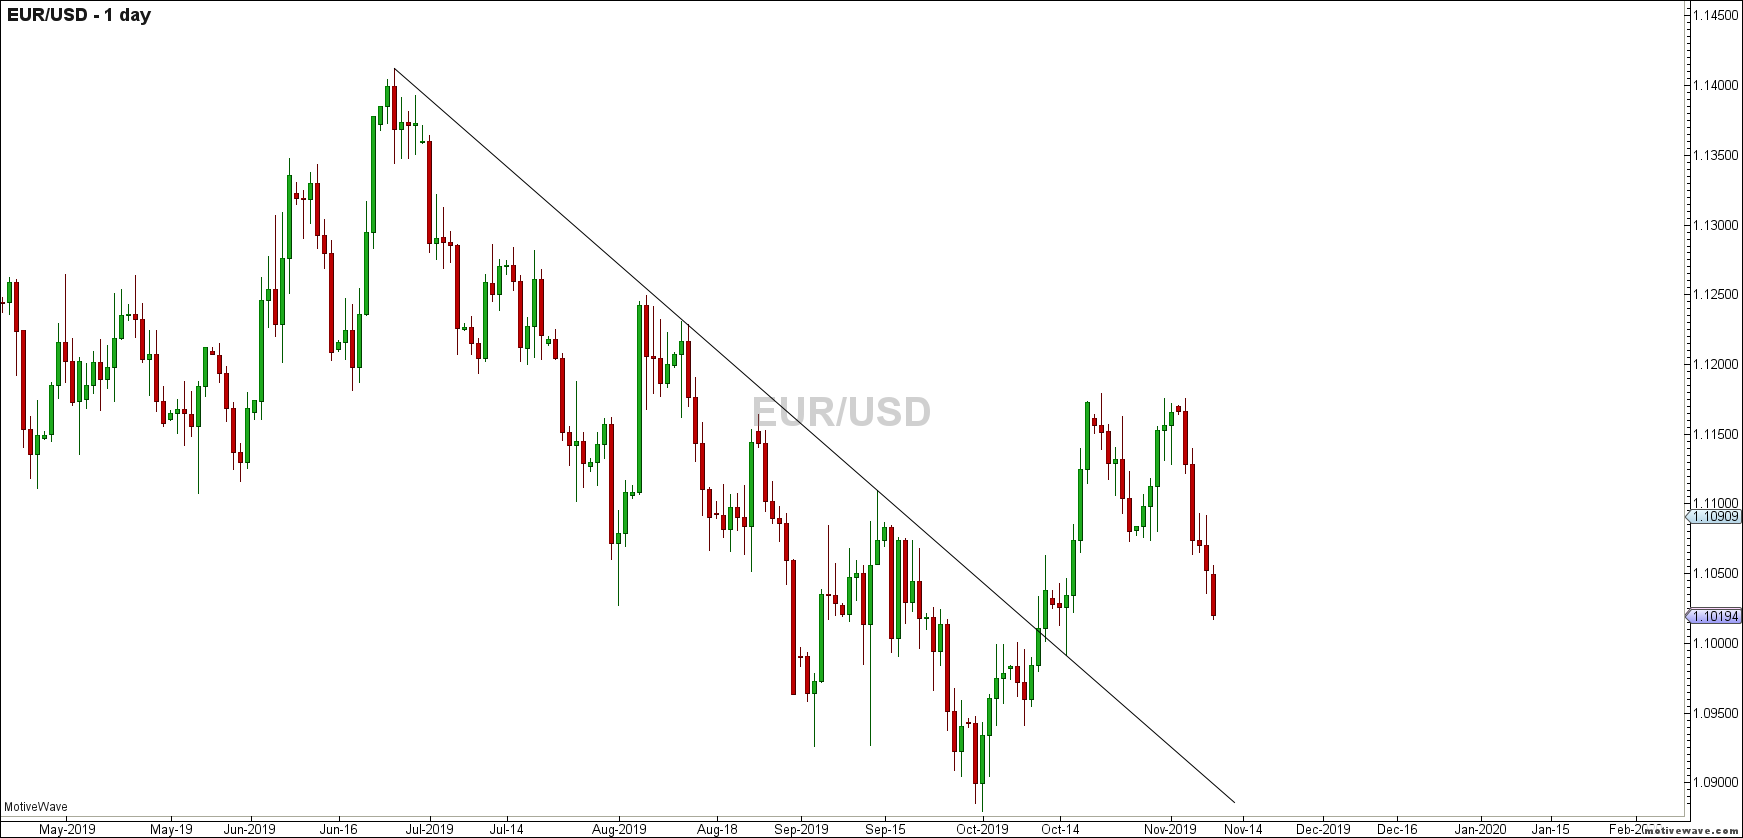
eurusd primary analysis nov 09 0004 am 1 day png


Add fibs and look for confluence and my wannabee wave count

Click image for original size
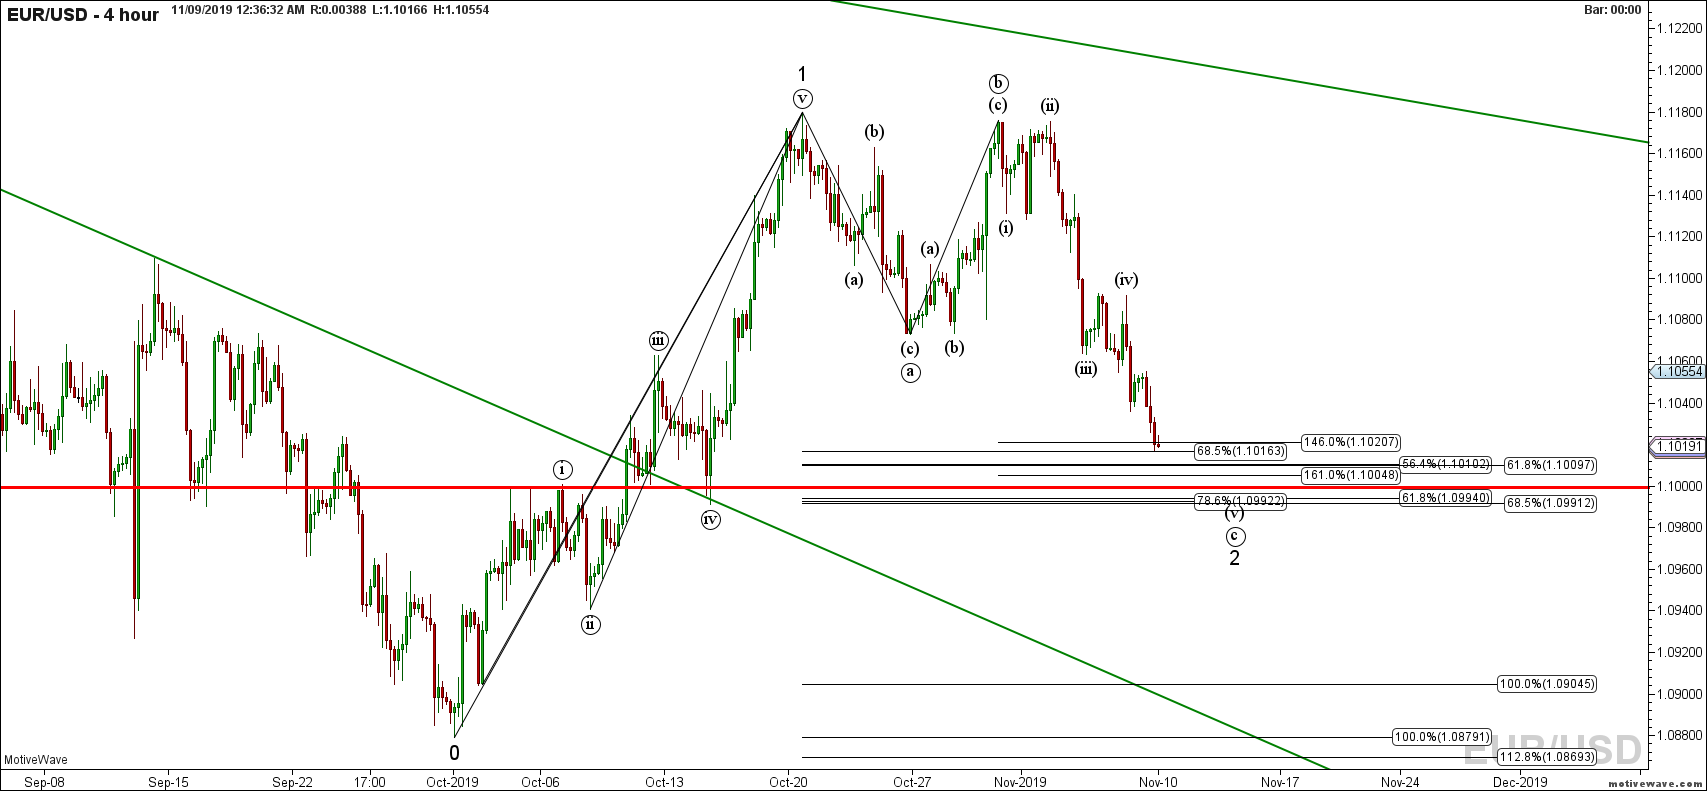
eurusd primary analysis nov 09 0036 am 4 hour png


Adding lines, it fits if it stops here, but what if it goes to 161.8 ?

Click image for original size
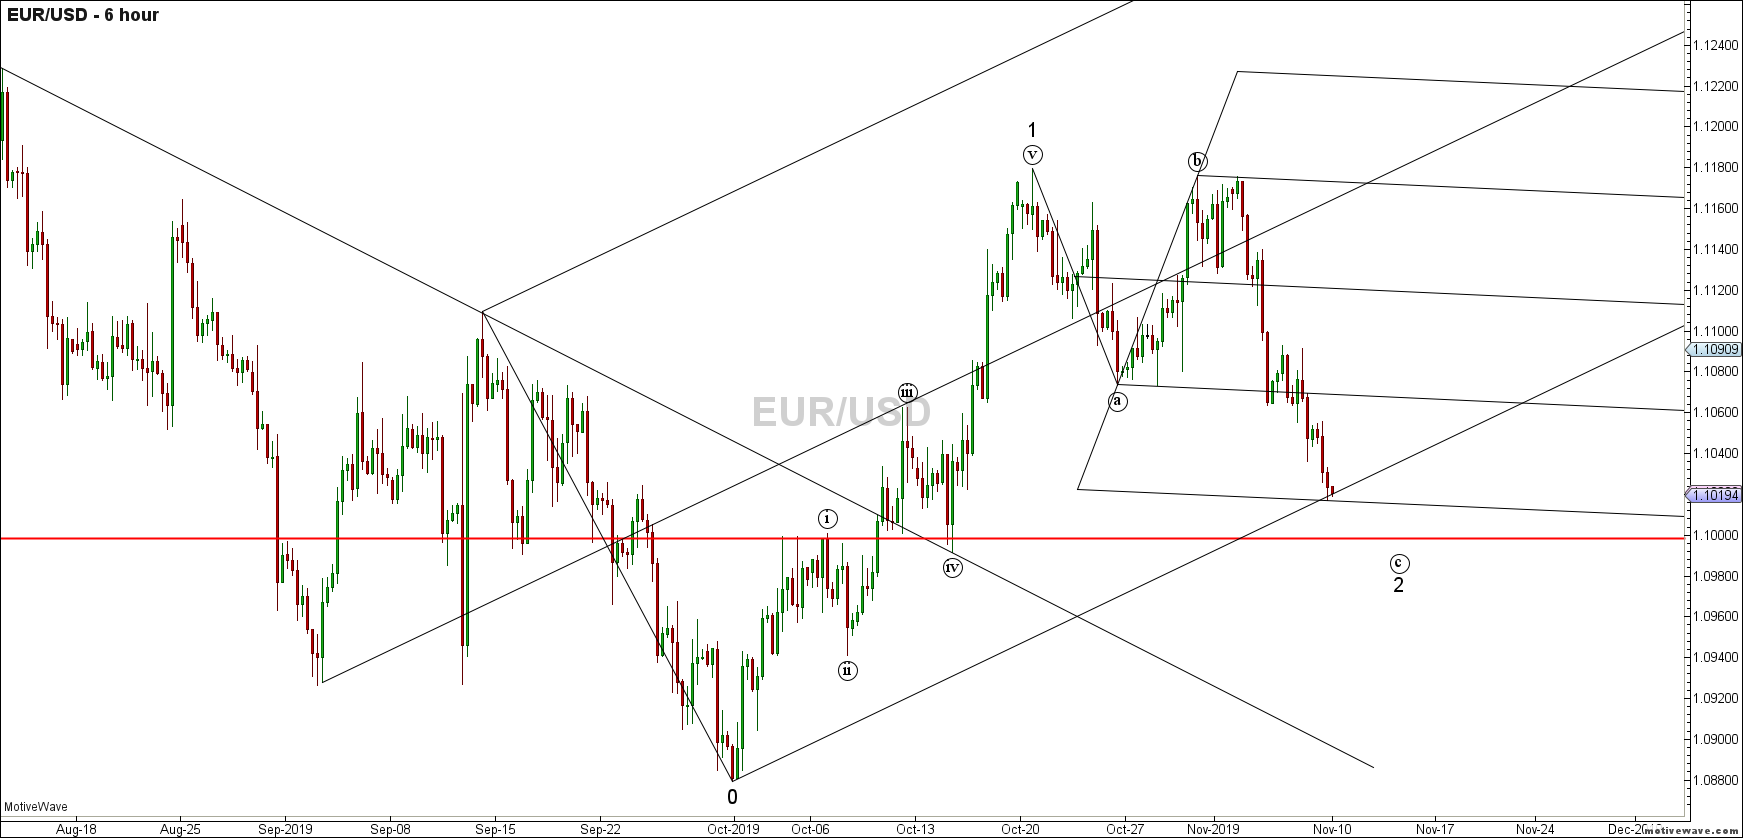
eurusd primary analysis nov 09 0049 am 6 hour png

Click image for original size
eurusd primary analysis nov 09 0048 am 4 hour png


Maybe this blue line ?
Click image for original size
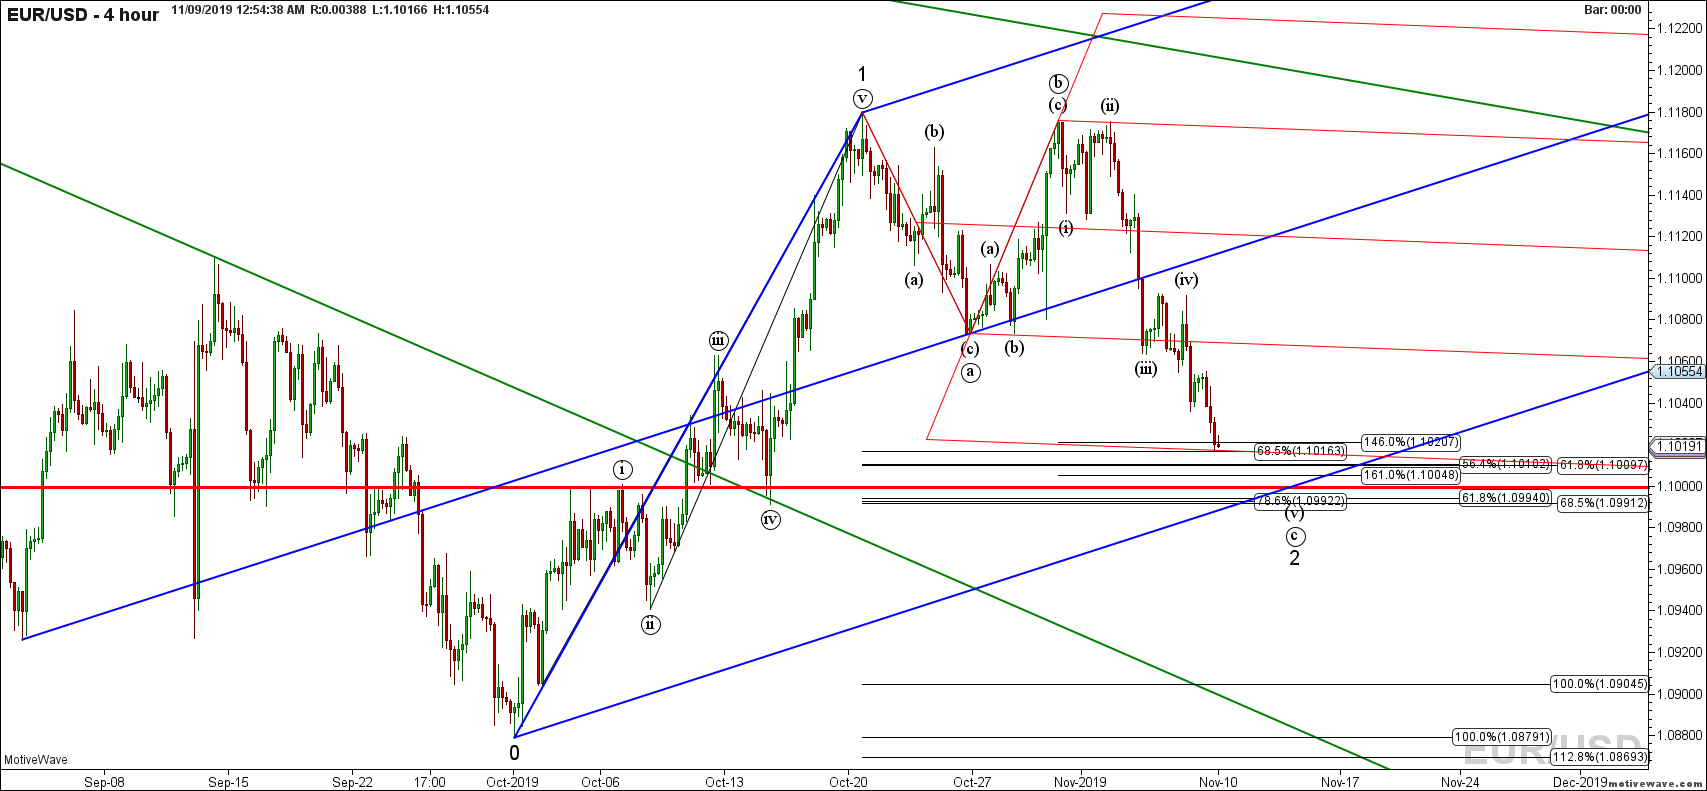
eurusd primary analysis nov 09 0054 am 4 hour png


Just thinking out loud while baby sitting my granddaughter.

Have a great weekend guys!!!
AL
albert
Rep: 99
Posts: 3,094
Duane,

Thanks for the compliment! Cool Euro analysis on your part. I have nothing to add, and I think that a price reversal in the euro is likely. My granddaughters are also over to the house today. My, they certainly have a lot of energy.
Best wishes for a graet weekend to you and all.
Al :--)

Originally posted by Duane

Hey Al, I thought that I would give you a break this week. Your diligence is certainly an asset that we all benefit from!

It's Friday night, and I have entered this EURUSD position against my trading plan, ( no trigger ) . And I know that I am going to take some heat because of it. After all the Market is the best teacher. I thought that 146.0 ext plus the lines would be a great place to enter, but alas, the price action is still bearish. This is a classic Double top ABCD, so if not 146.0 the next stop is 161.0 So where are the lines?

Lets start from the beginning. Down trend with break and retest of down trend line.

Click image for original size
eurusd primary analysis nov 09 0004 am 1 day png


Add fibs and look for confluence and my wannabee wave count

Click image for original size
eurusd primary analysis nov 09 0036 am 4 hour png


Adding lines, it fits if it stops here, but what if it goes to 161.8 ?

Click image for original size
eurusd primary analysis nov 09 0049 am 6 hour png

Click image for original size
eurusd primary analysis nov 09 0048 am 4 hour png


Maybe this blue line ?
Click image for original size
eurusd primary analysis nov 09 0054 am 4 hour png


Just thinking out loud while baby sitting my granddaughter.

Have a great weekend guys!!!
RA
rat89
Rep: 0
Posts: 7,015
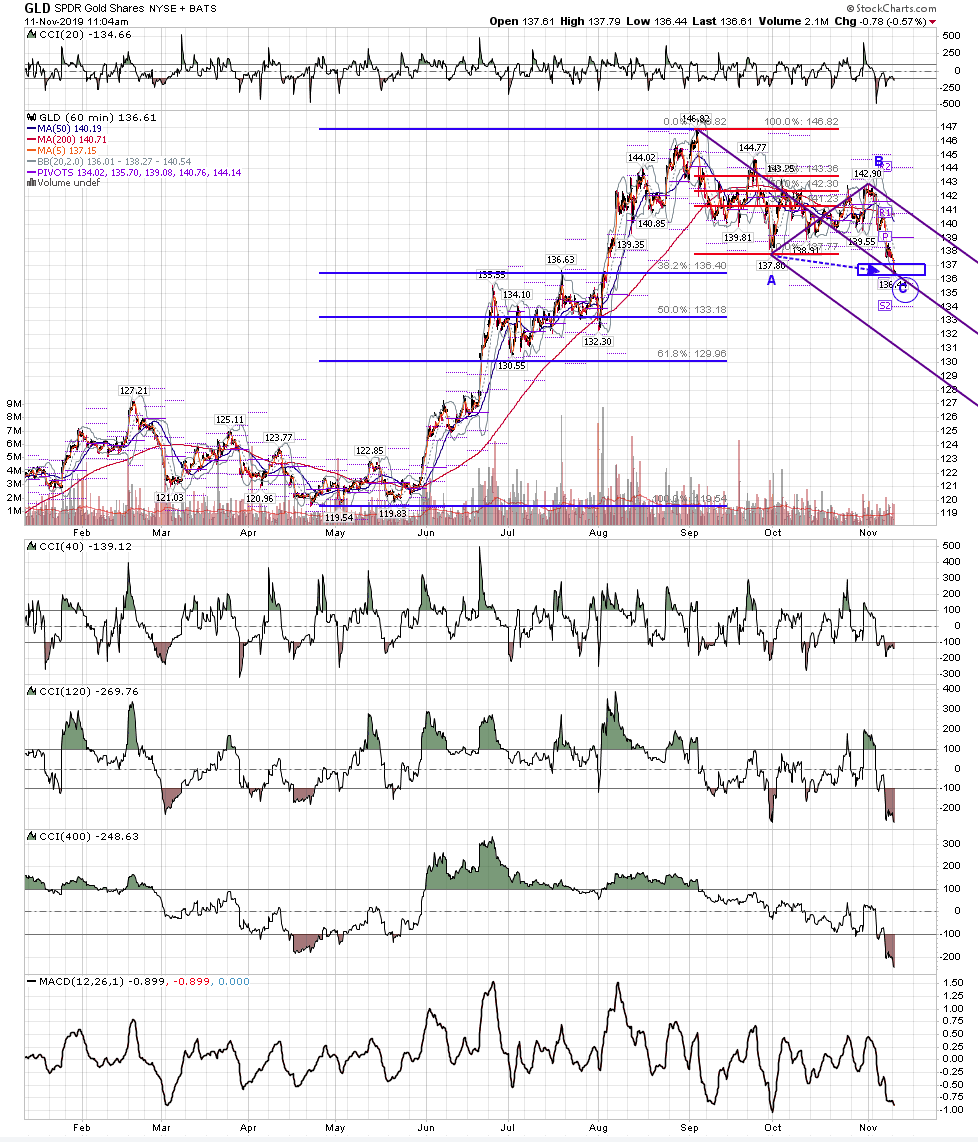
gld 60 - at the .382 rt and the 1.27 external rt of the A-B move up....

Click image for original size
screen shot 2019 11 11 at 11 04 15 am png
MA
MarcinO
Rep: 67
Posts: 5,506
Good shot Duane. So far the Euro has responded a little bit right off the top of your area, but on Mondays it is hard to expect a nice volatility.
My experience is that Mondays are usuall dull, with slow, corrective move the whole day. The only exception is when the markets open up with a substantial gap after the weekend. This is when I prefer to trade on Sunday night or in the early morning. But for H4/D1 time frame it doesn't really matter.

Originally posted by Duane

Hey Al, I thought that I would give you a break this week. Your diligence is certainly an asset that we all benefit from!

It's Friday night, and I have entered this EURUSD position against my trading plan, ( no trigger ) . And I know that I am going to take some heat because of it. After all the Market is the best teacher. I thought that 146.0 ext plus the lines would be a great place to enter, but alas, the price action is still bearish. This is a classic Double top ABCD, so if not 146.0 the next stop is 161.0 So where are the lines?

Lets start from the beginning. Down trend with break and retest of down trend line.

Click image for original size
eurusd primary analysis nov 09 0004 am 1 day png


Add fibs and look for confluence and my wannabee wave count

Click image for original size
eurusd primary analysis nov 09 0036 am 4 hour png


Adding lines, it fits if it stops here, but what if it goes to 161.8 ?


Maybe this blue line ?


Just thinking out loud while baby sitting my granddaughter.

Have a great weekend guys!!!
AL
albert
Rep: 99
Posts: 3,094
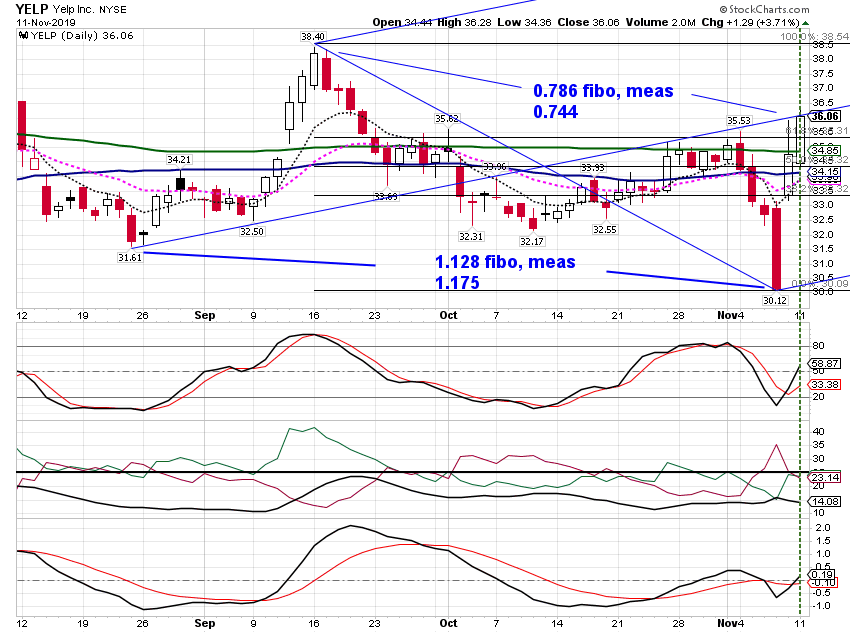
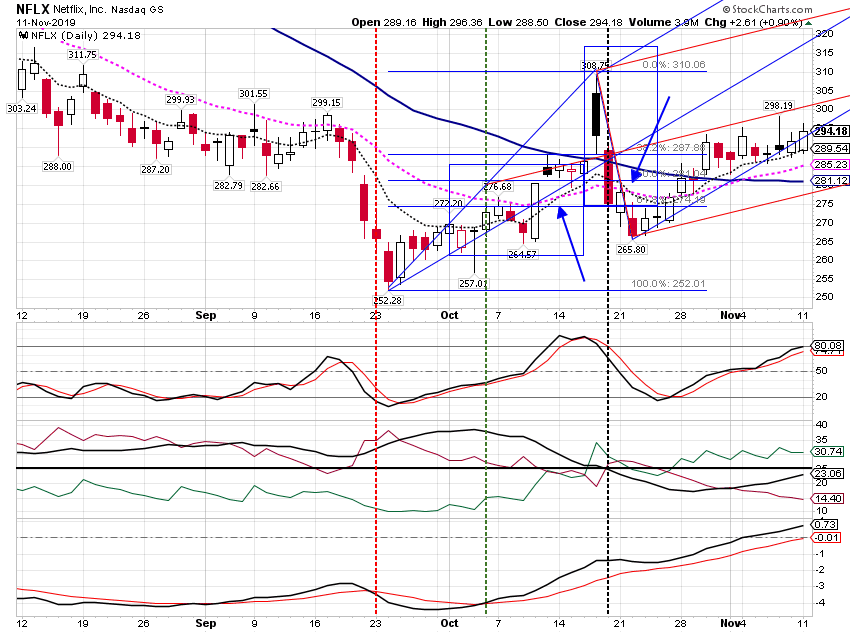
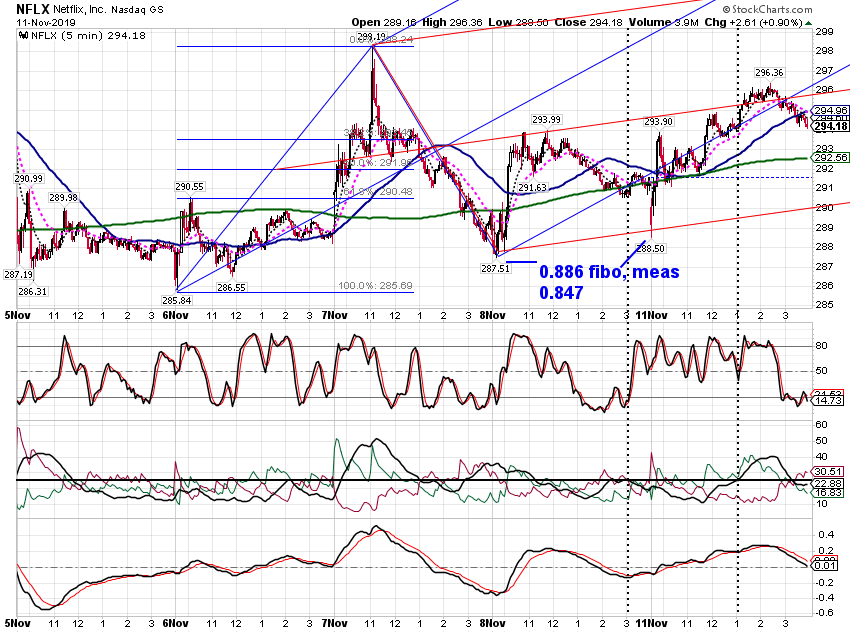
Paper trading. Made a bit on a long NFLX call. Lost some on a yelp long call. I made more than I lost.

Al :--)


Click image for original size
sc1805 png


Click image for original size
sc1806 png


Click image for original size
sc1807 png
MA
MarcinO
Rep: 67
Posts: 5,506
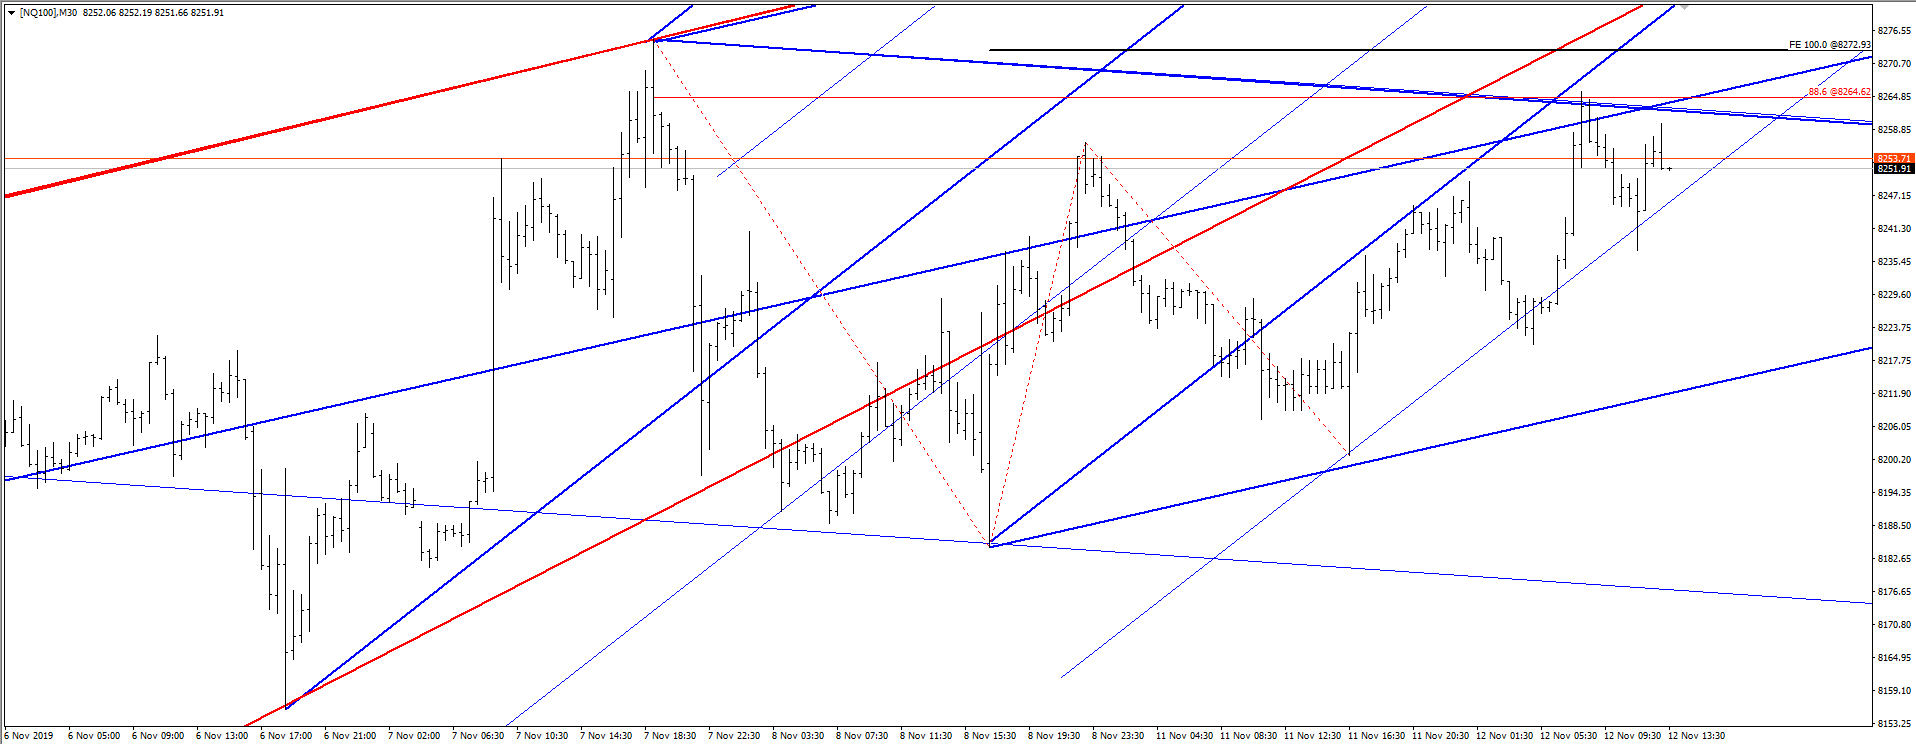
If this 1.0 ABCD above .886 provides a reaction it will define a bearish bias for at least a couple of days on Nasdaq. We will see.

Click image for original size
nq 2019 11 12 png
MA
MarcinO
Rep: 67
Posts: 5,506
Of course one more push up within CD leg should be expected here.
RA
rat89
Rep: 0
Posts: 7,015
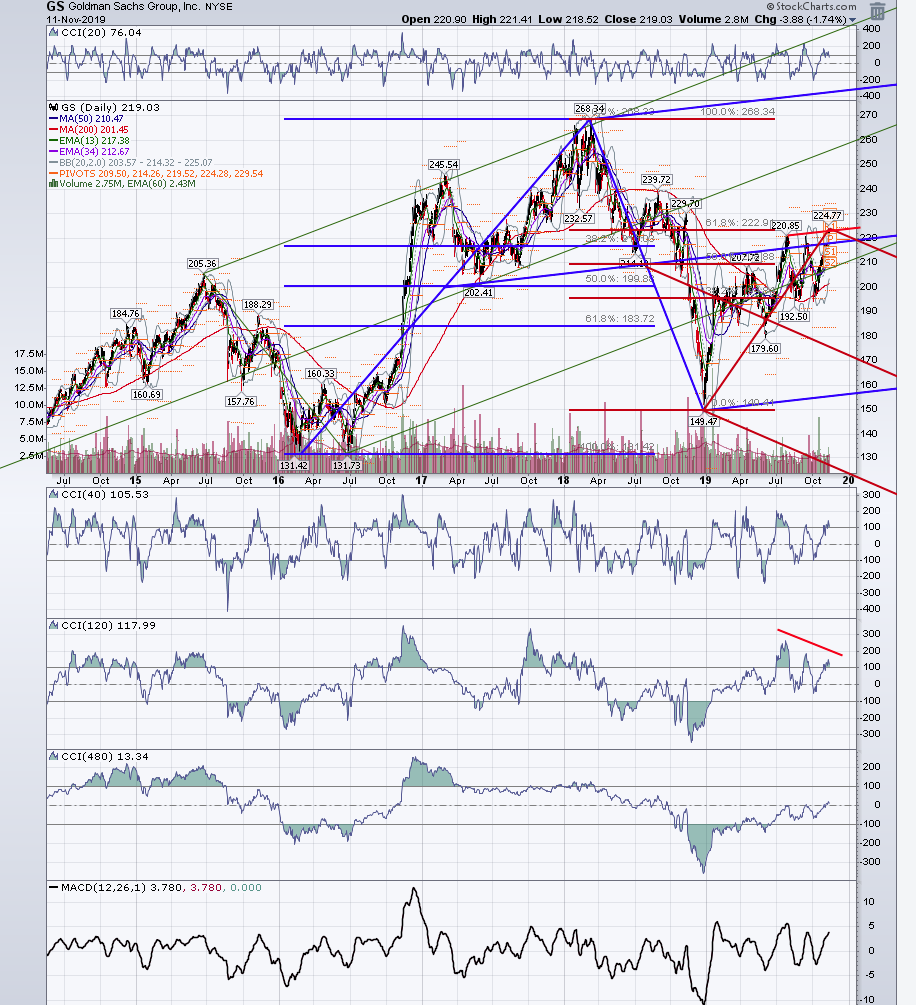
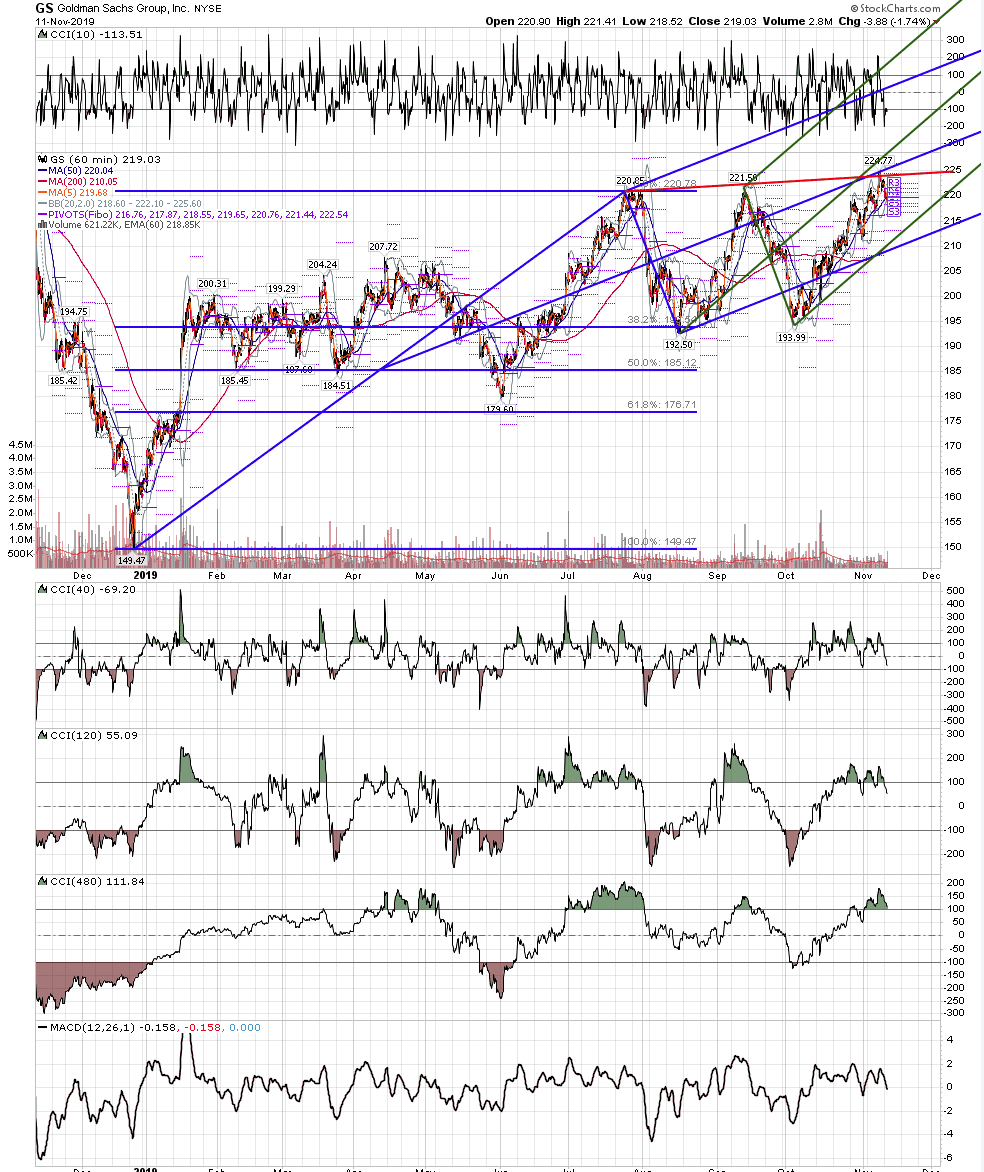
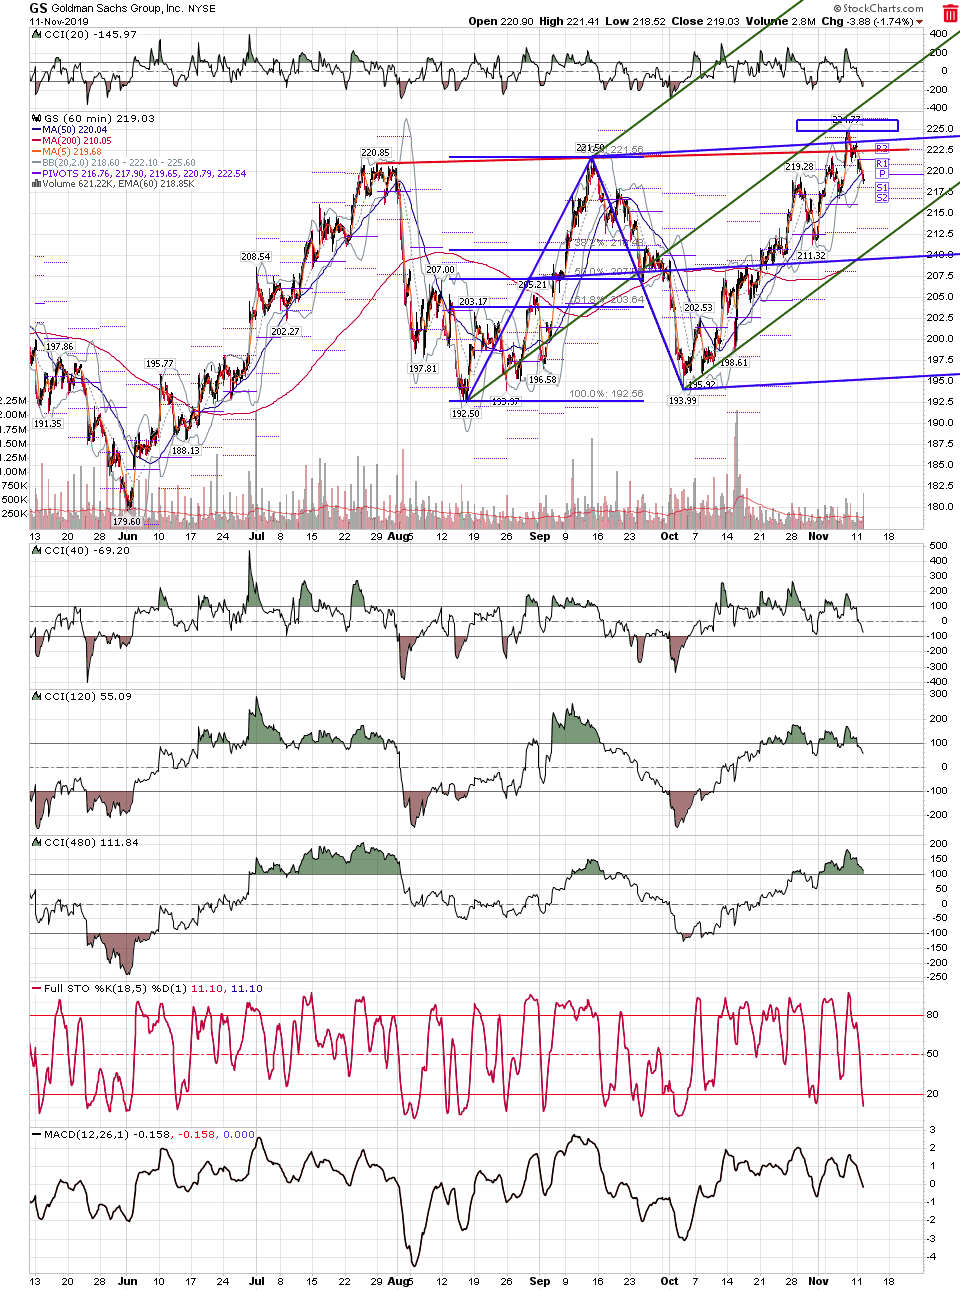
gs - I may be premature in drawing this red median line set, but gs now has price making three pushes over the blue median line along a trend line, with negative divergence, at the DFF from September 2018. Zooming in to the 60 minute, there is a potential double 1.128 external retrace, and a little higher, a potential double 1.27 retrace. When this is good an ready, it could move down sharply.
Click image for original size
screen shot 2019 11 12 at 8 51 44 am png

Click image for original size
screen shot 2019 11 12 at 8 43 18 am png

Click image for original size
screen shot 2019 11 12 at 8 45 27 am png
MA
MarcinO
Rep: 67
Posts: 5,506
Bull$#!^ market continues...
Originally posted by MarcinO

If this 1.0 ABCD above .886 provides a reaction it will define a bearish bias for at least a couple of days on Nasdaq. We will see.

MA
MarcinO
Rep: 67
Posts: 5,506
8300 can be tested today I guess.
AL
albert
Rep: 99
Posts: 3,094
rat,

Would you please explain to me what DFF is?

Thanks,

Al :--)

Originally posted by rat89

gs - I may be premature in drawing this red median line set, but gs now has price making three pushes over the blue median line along a trend line, with negative divergence, at the DFF from September 2018. Zooming in to the 60 minute, there is a potential double 1.128 external retrace, and a little higher, a potential double 1.27 retrace. When this is good an ready, it could move down sharply.
Click image for original size
screen shot 2019 11 12 at 8 51 44 am png

Click image for original size
screen shot 2019 11 12 at 8 43 18 am png

Click image for original size
screen shot 2019 11 12 at 8 45 27 am png

AL
albert
Rep: 99
Posts: 3,094
Super high-quality analyses, guys.

Al :--)