MyPivots
Sign In
DU
Duane
Rep: 100
Posts: 1,095
Hey Al, I thought that I would give you a break this week. Your diligence is certainly an asset that we all benefit from!

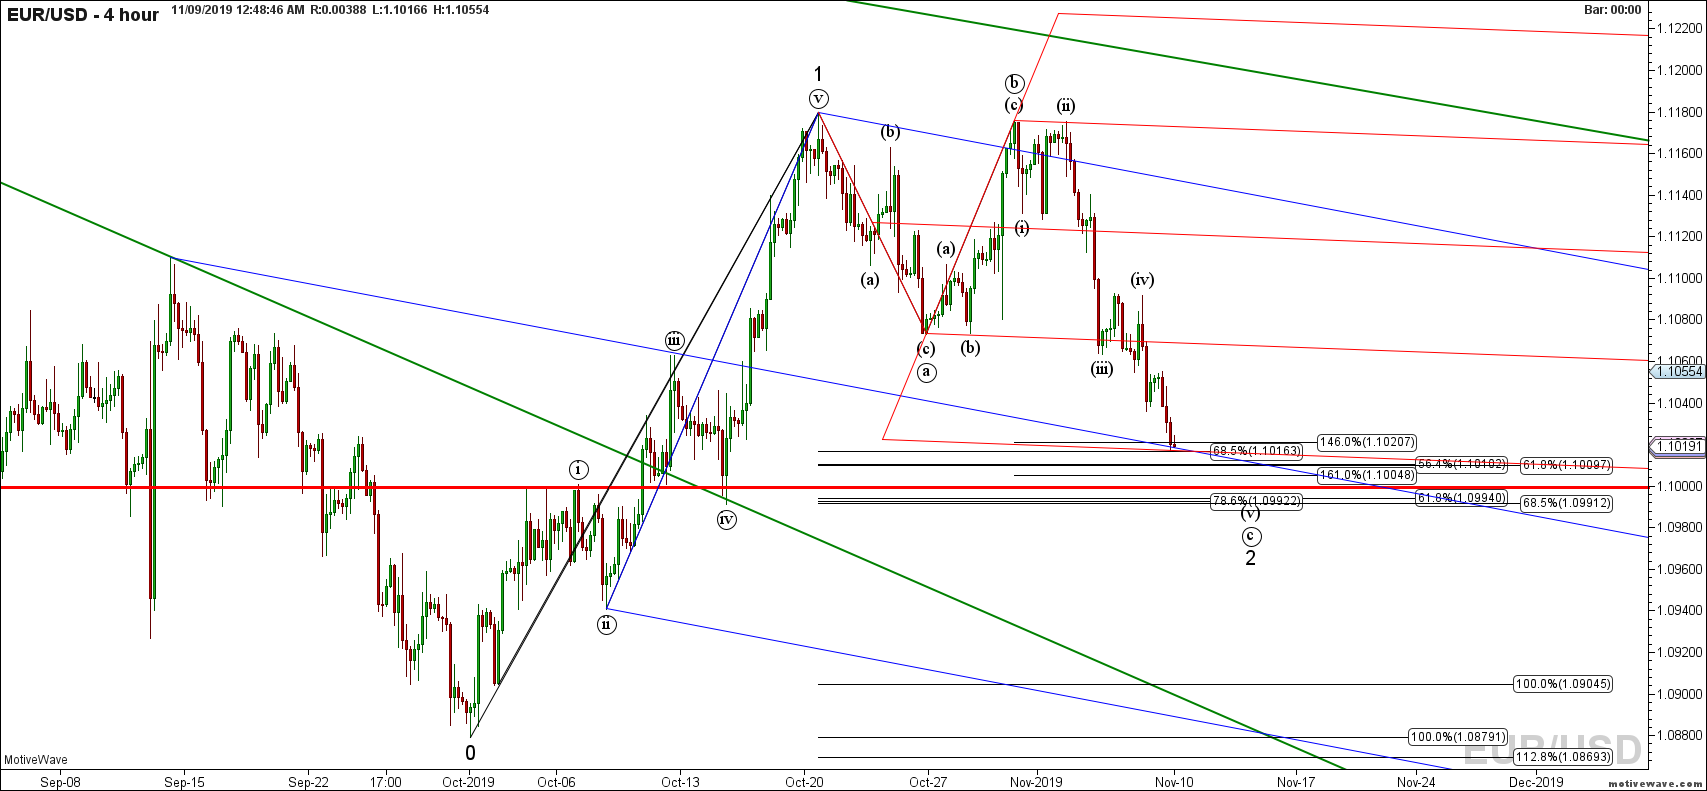
It's Friday night, and I have entered this EURUSD position against my trading plan, ( no trigger ) . And I know that I am going to take some heat because of it. After all the Market is the best teacher. I thought that 146.0 ext plus the lines would be a great place to enter, but alas, the price action is still bearish. This is a classic Double top ABCD, so if not 146.0 the next stop is 161.0 So where are the lines?

Lets start from the beginning. Down trend with break and retest of down trend line.

Click image for original size
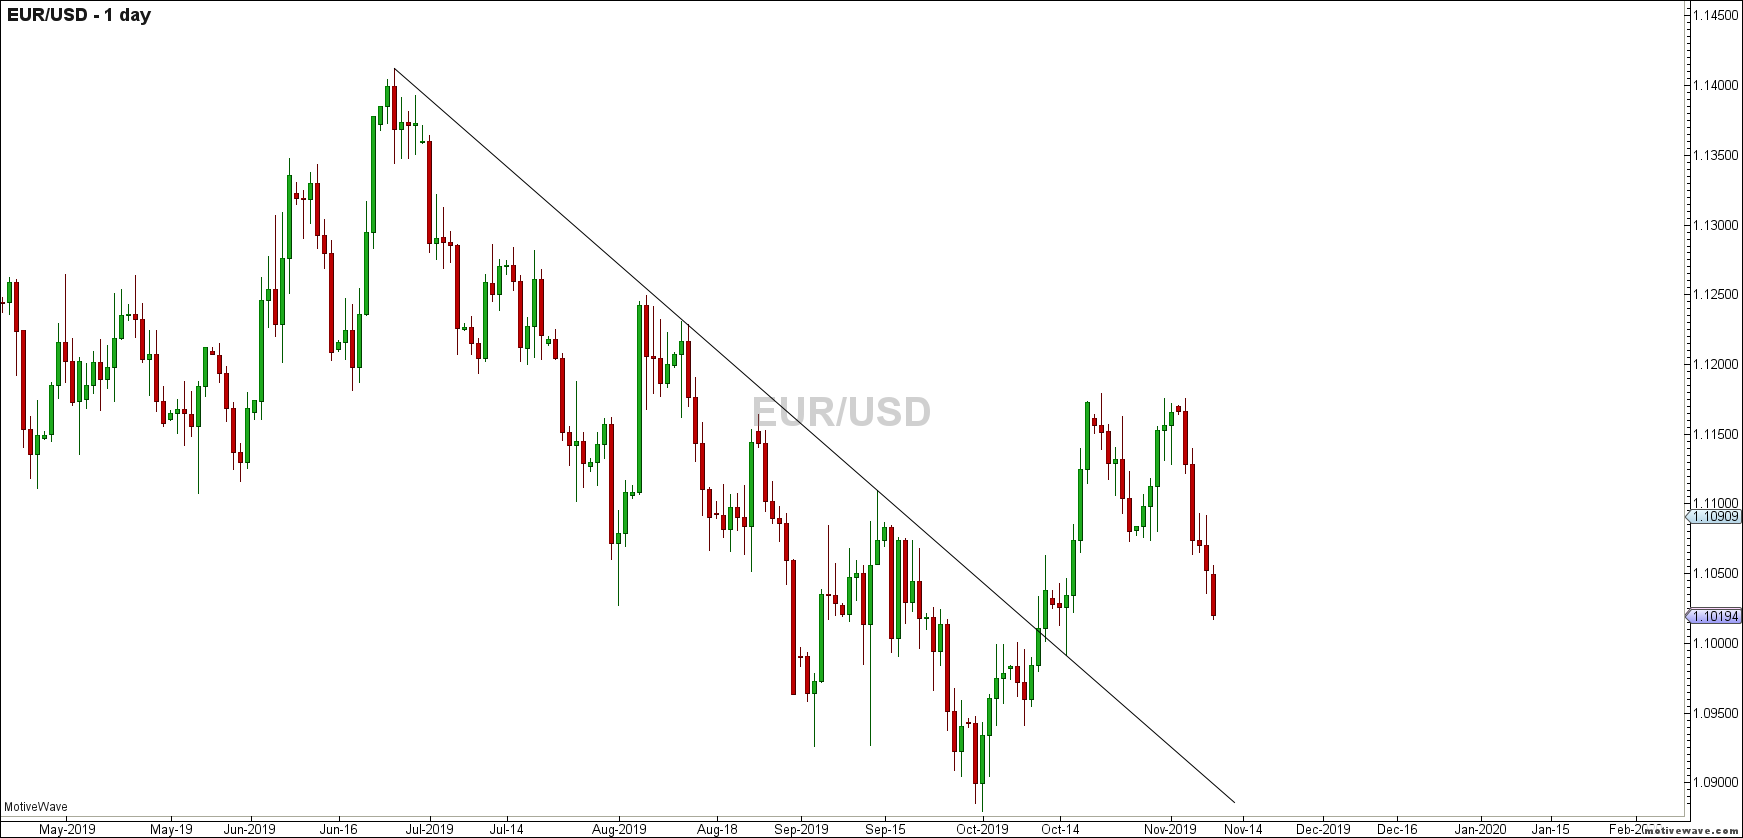
eurusd primary analysis nov 09 0004 am 1 day png


Add fibs and look for confluence and my wannabee wave count

Click image for original size
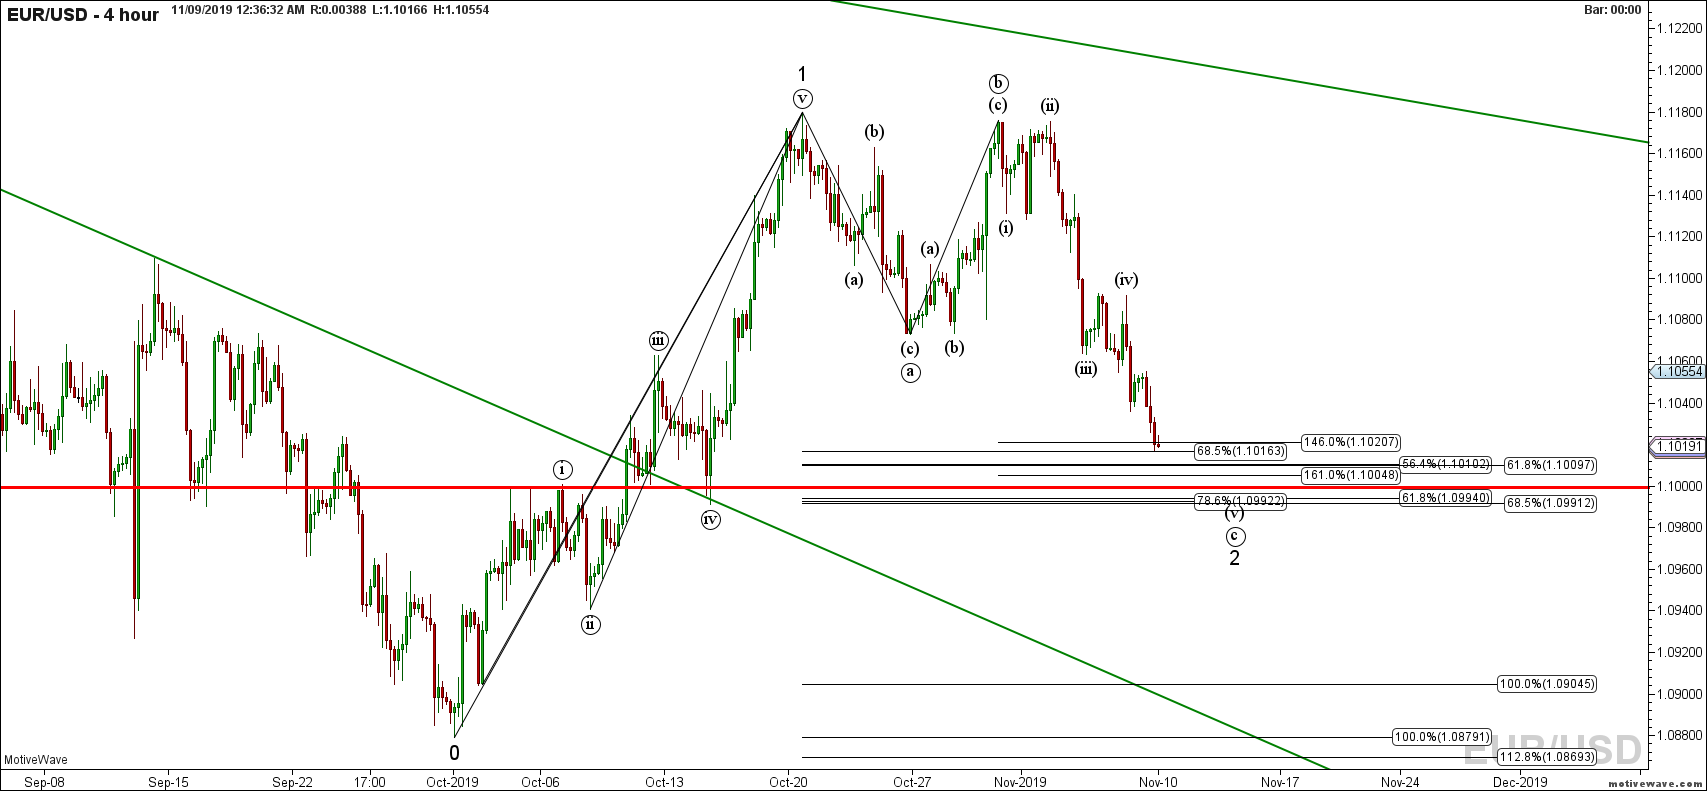
eurusd primary analysis nov 09 0036 am 4 hour png


Adding lines, it fits if it stops here, but what if it goes to 161.8 ?

Click image for original size
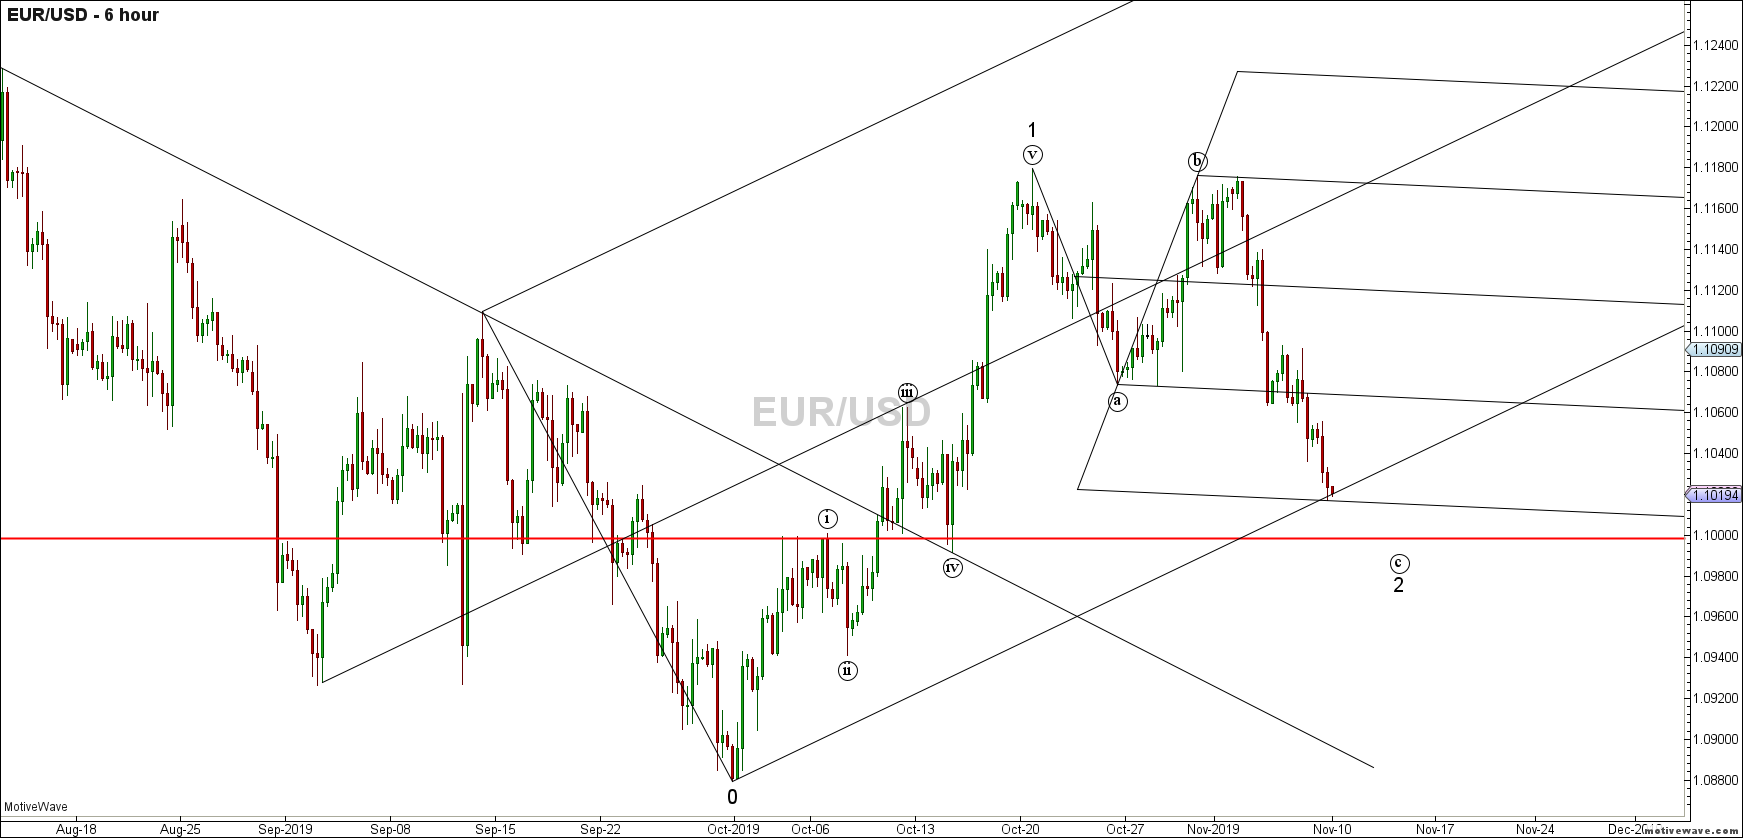
eurusd primary analysis nov 09 0049 am 6 hour png

Click image for original size
eurusd primary analysis nov 09 0048 am 4 hour png


Maybe this blue line ?
Click image for original size
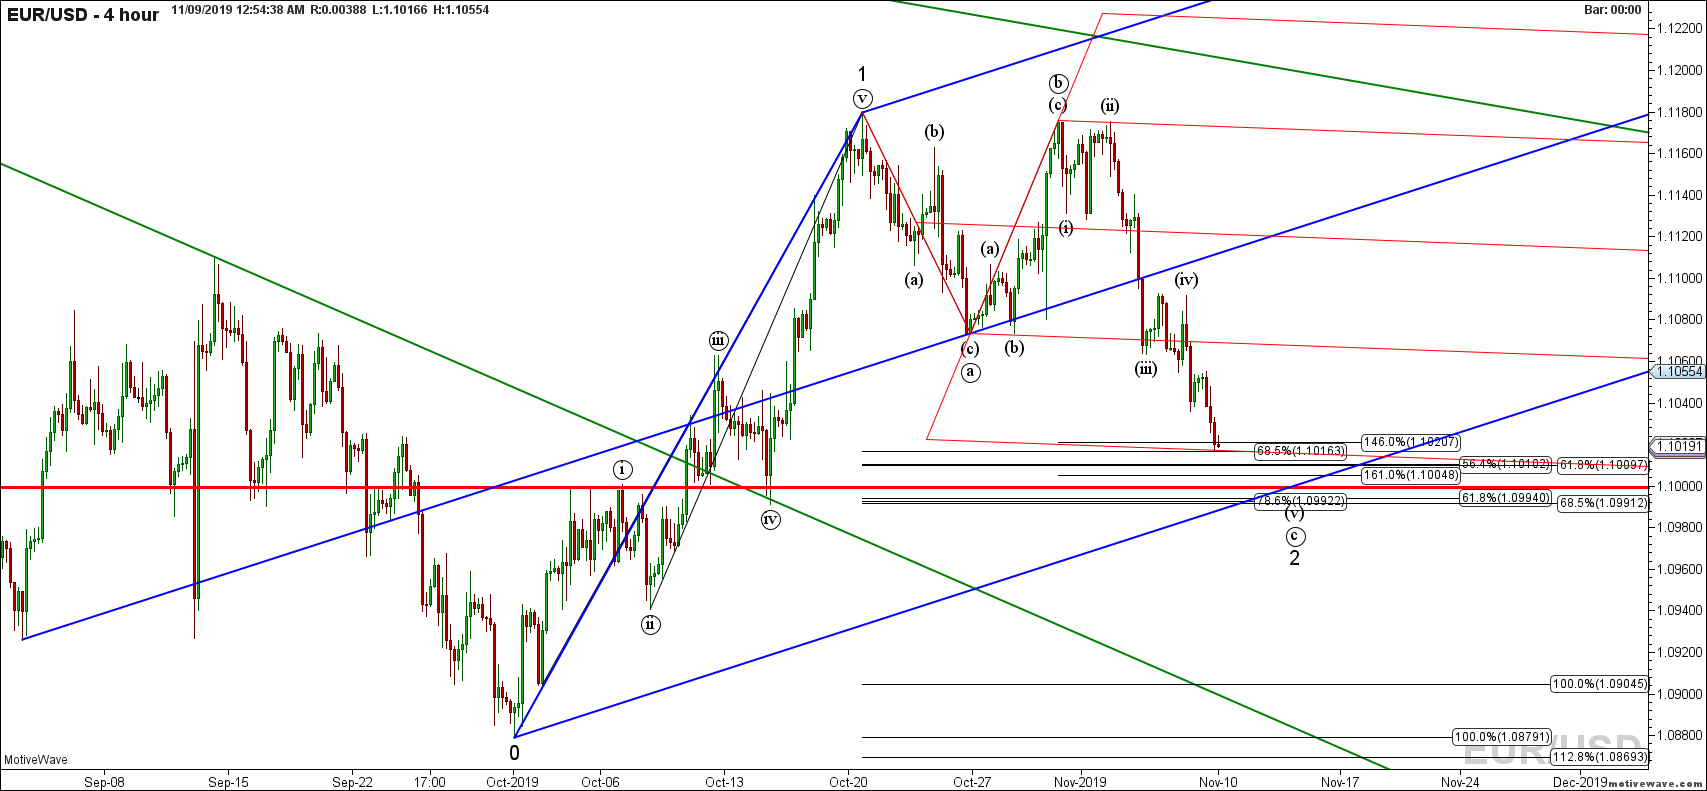
eurusd primary analysis nov 09 0054 am 4 hour png


Just thinking out loud while baby sitting my granddaughter.

Have a great weekend guys!!!
AL
albert
Rep: 99
Posts: 3,094
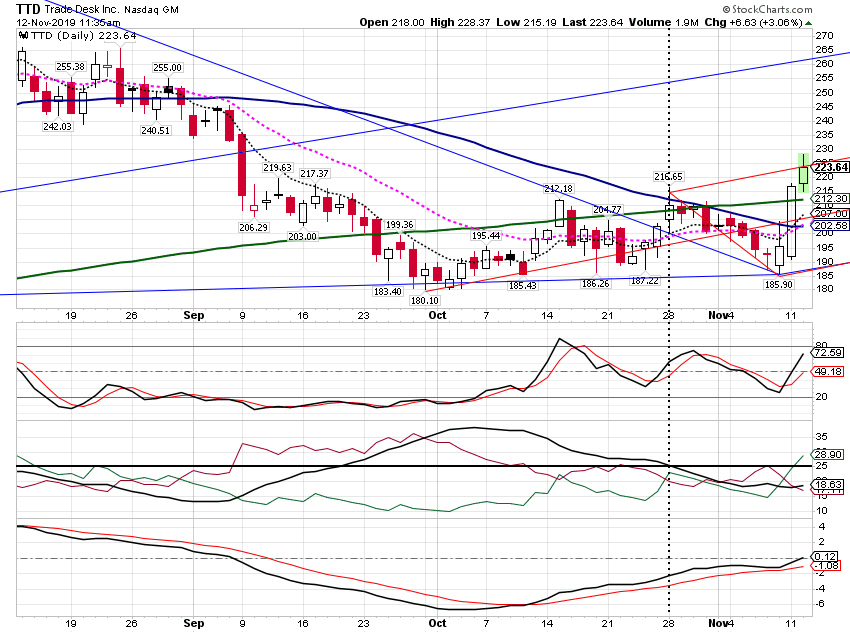
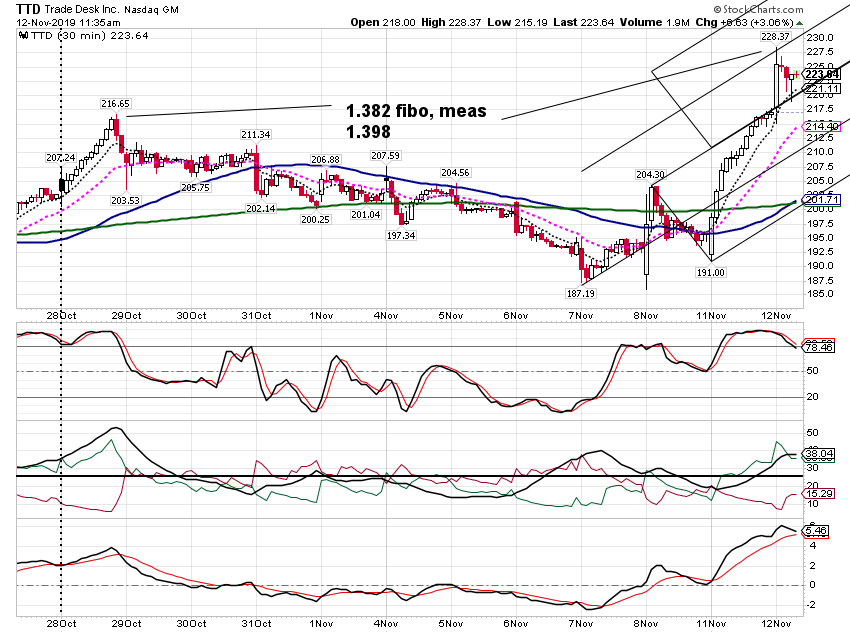
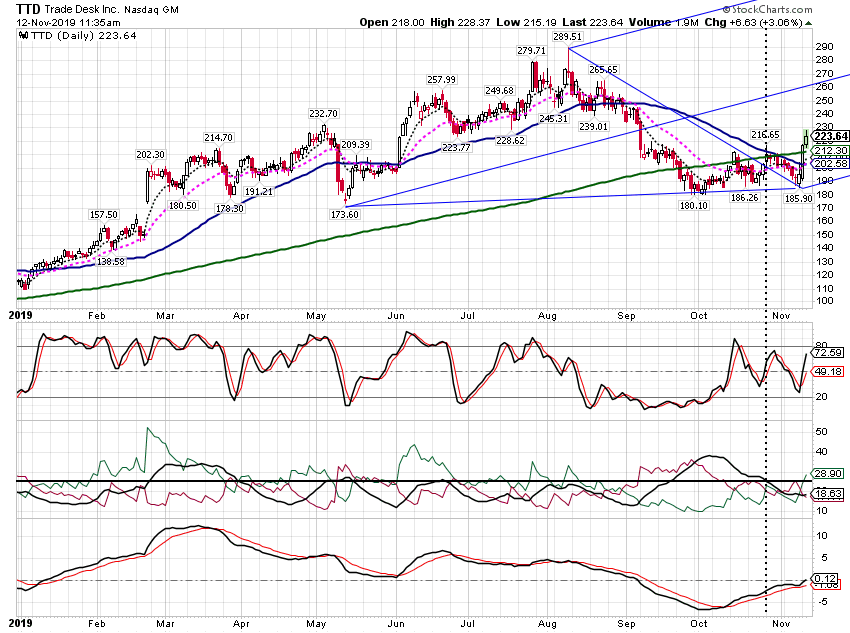
Paper trading. Made a bit in TDD.

Al :--)


Click image for original size
sc1808 png


Click image for original size
sc1809 png


Click image for original size
sc1810 png
RA
rat89
Rep: 0
Posts: 7,015
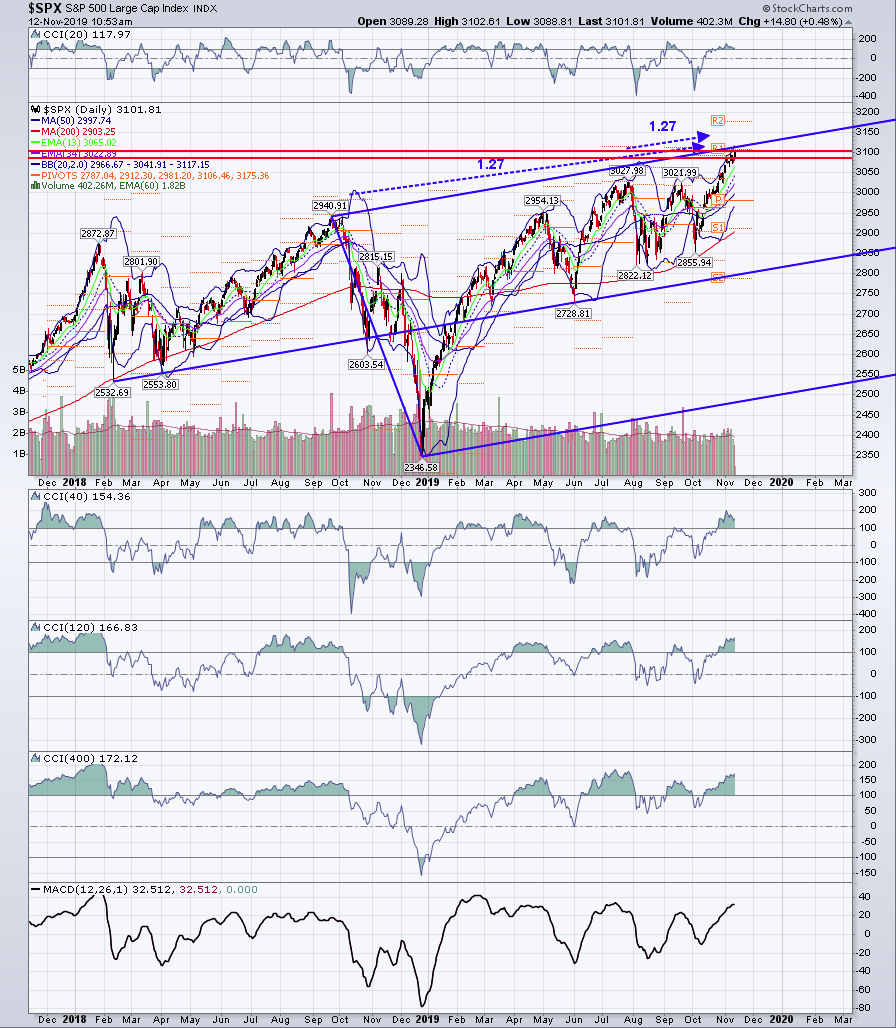
potential reversal on spx still in play here....
Click image for original size
screen shot 2019 11 12 at 10 53 19 am png

Click image for original size
screen shot 2019 11 12 at 10 37 57 am png
RA
rat89
Rep: 0
Posts: 7,015
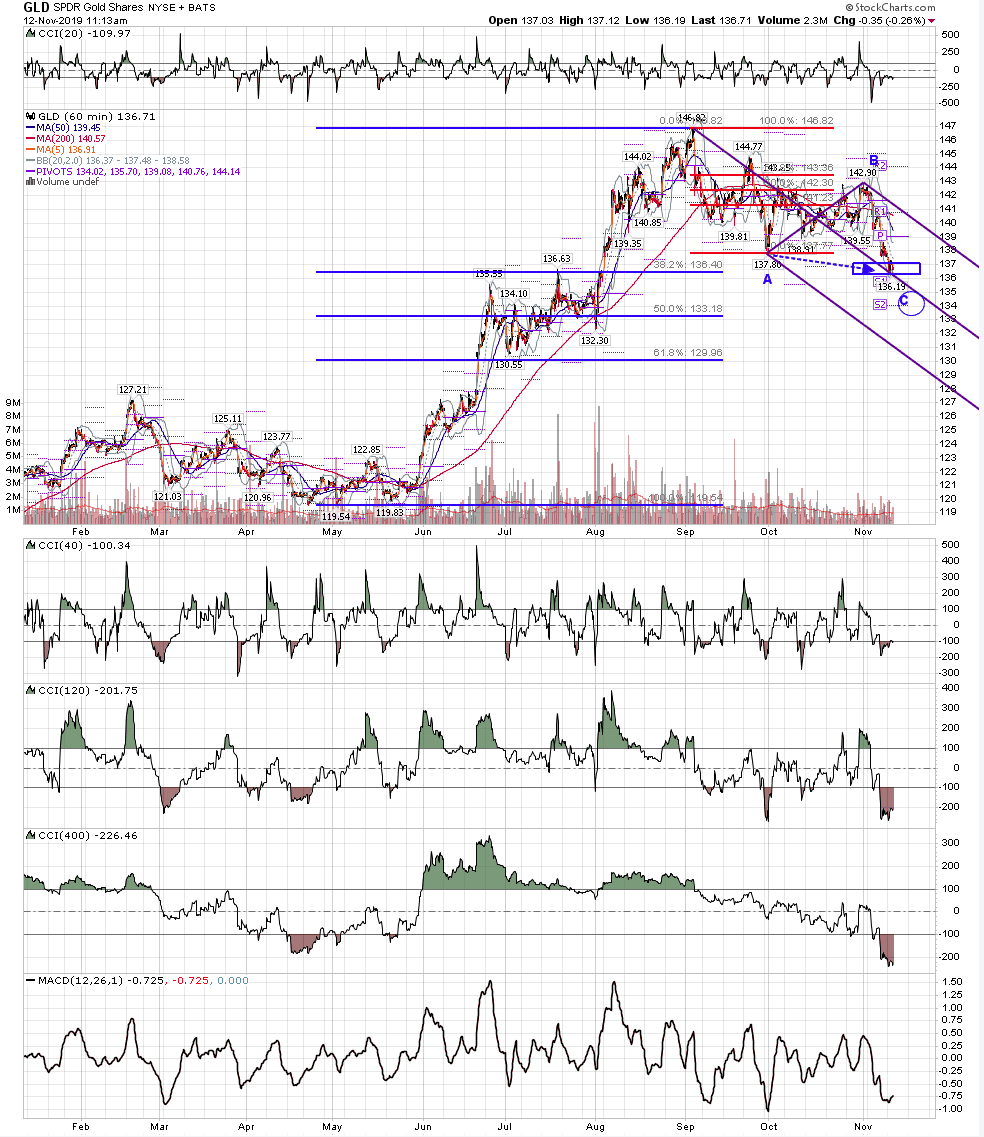
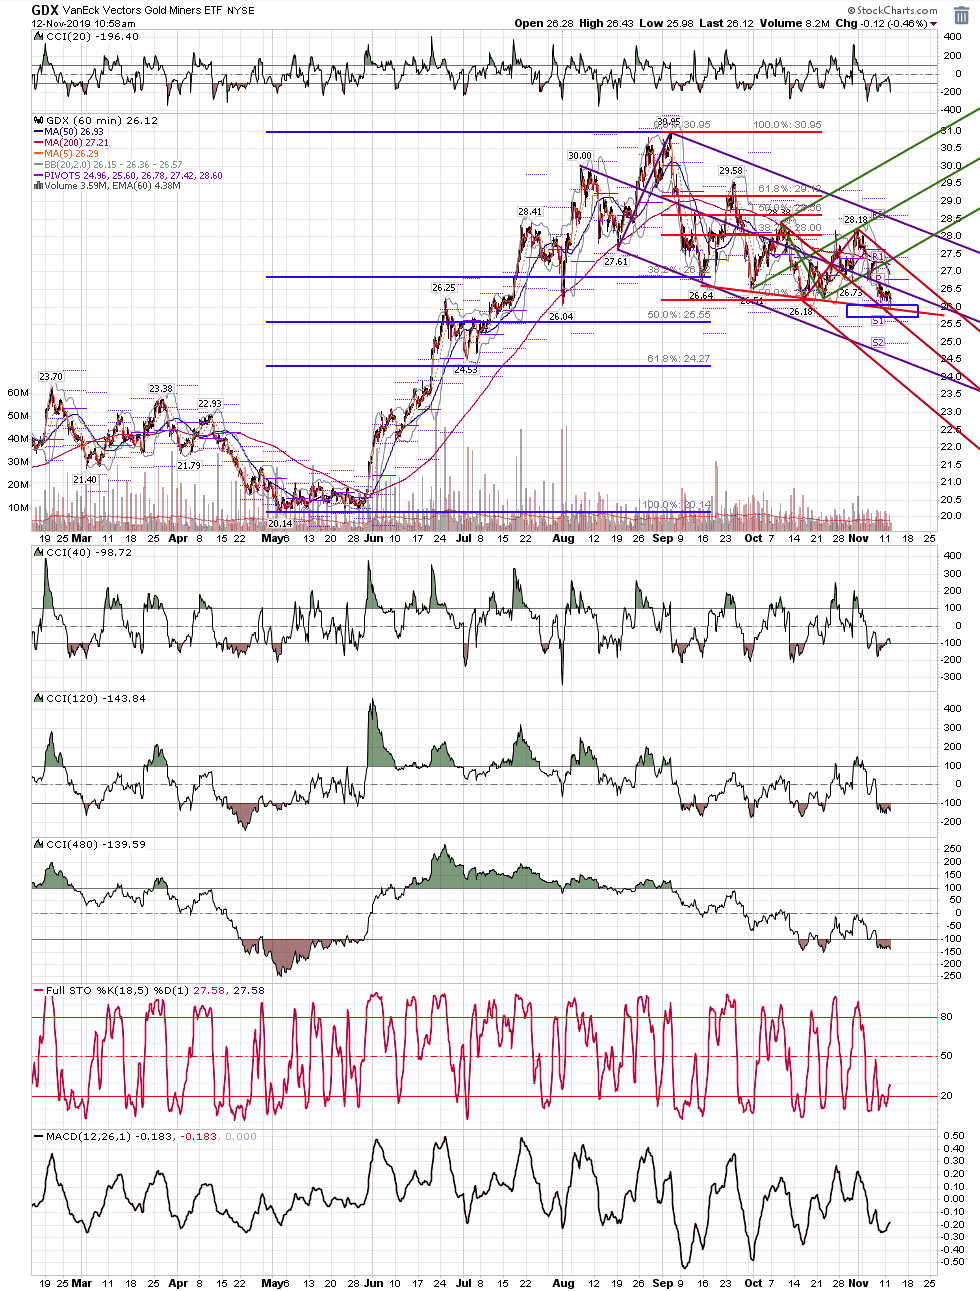
gld gdx
Click image for original size
screen shot 2019 11 12 at 11 13 26 am png

Click image for original size
screen shot 2019 11 12 at 10 58 36 am png
AL
albert
Rep: 99
Posts: 3,094
Cool work, guys.

Al :--)
AL
albert
Rep: 99
Posts: 3,094
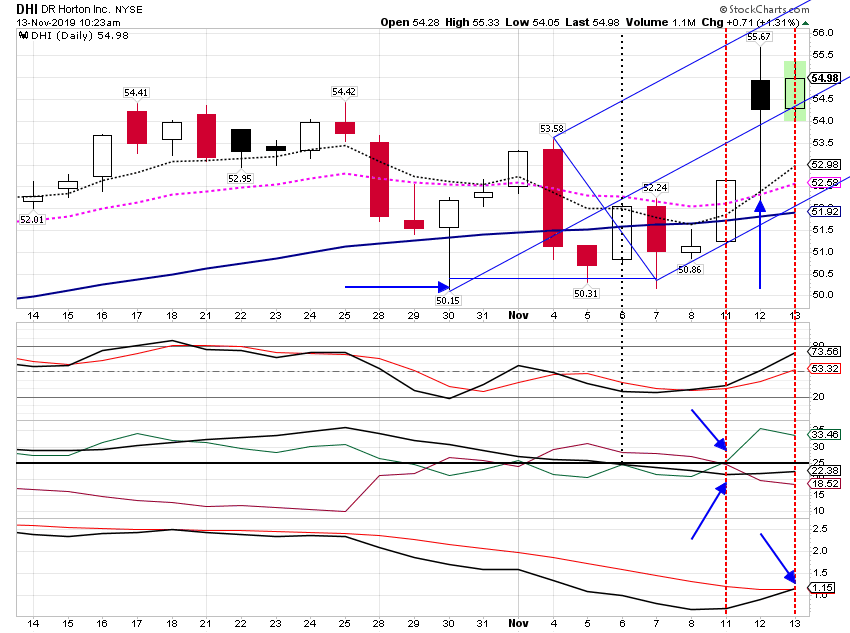
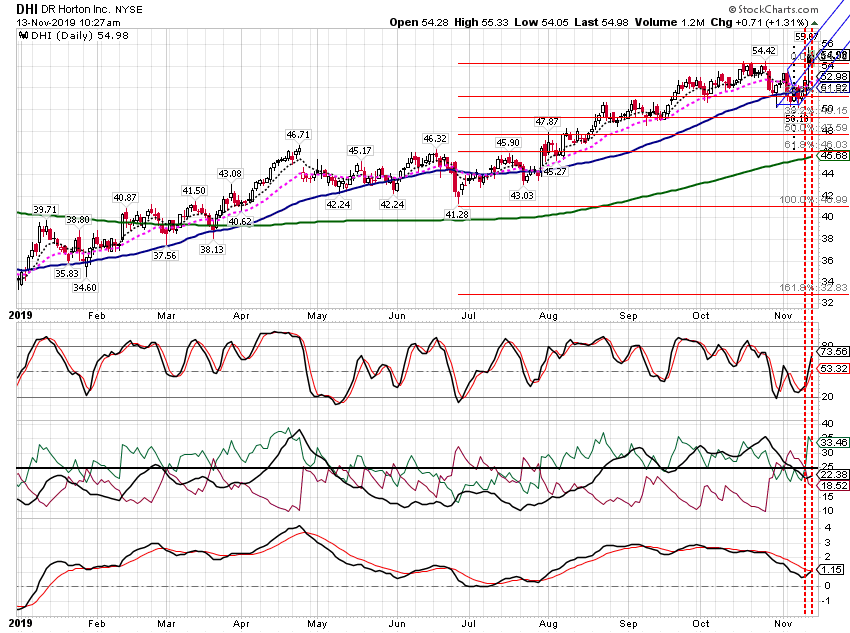
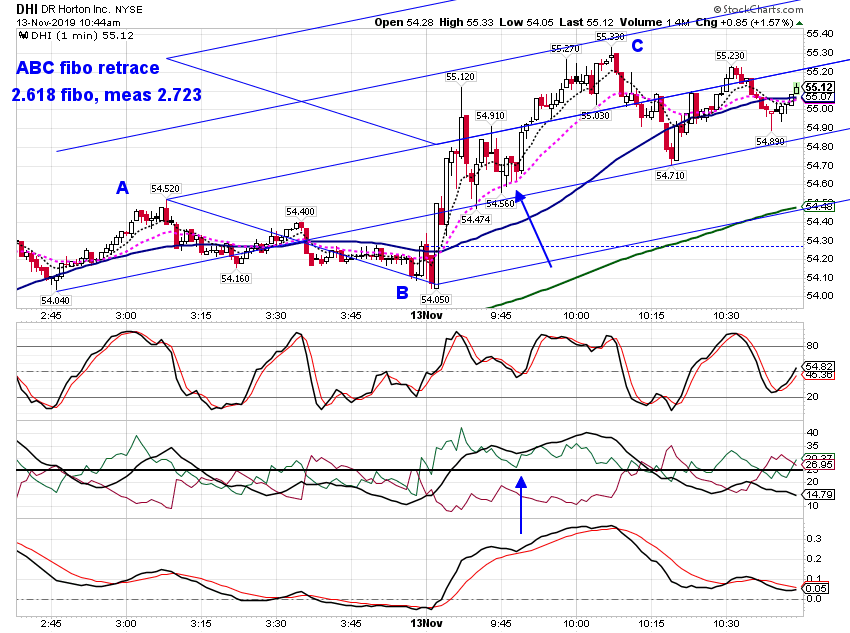
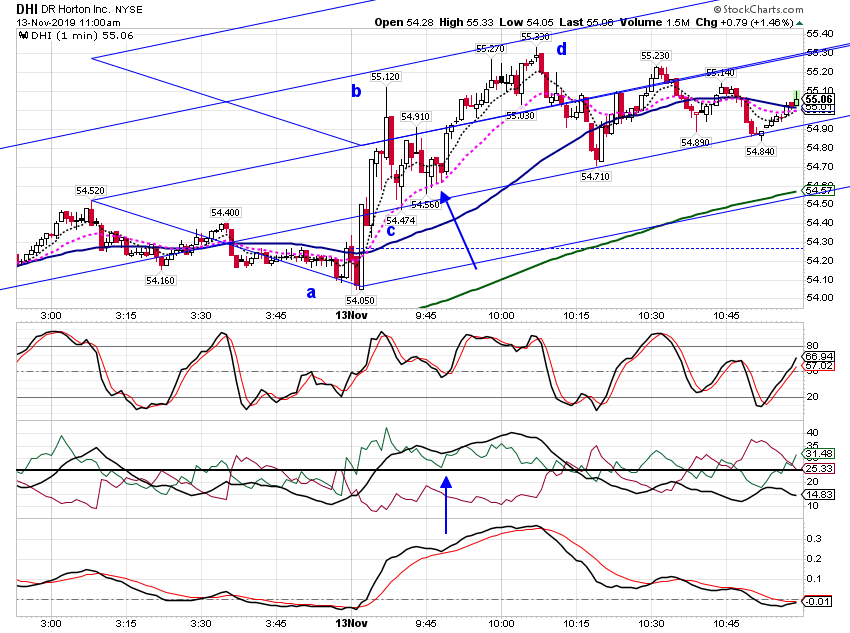
Paper trading, Made a bit on a long DHI call. DHI reported earnings and had an all time high yesterday.

Al :--)


Click image for original size
sc1811 png

Click image for original size
sc1813 png

Click image for original size
sc1812 png
AL
albert
Rep: 99
Posts: 3,094
Here is a renumbered 1 min chart showing an X*ab=cd in the opening upleg. Please note the +DI reversal UP at the 25 line on the 1min chart.

X*ab=cd
Fibo abc = 0.618, 0.604 meas
X = 0.886, 0.800 meas
Fibo bcd = 1.382,1.325 meas

Click image for original size
sc1814 png


Al :--)

Originally posted by albert

Paper trading, Made a bit on a long DHI call. DHI reported earnings and had an all time high yesterday.

Al :--)


Click image for original size
sc1811 png

Click image for original size
sc1813 png

Click image for original size
sc1812 png

RA
rat89
Rep: 0
Posts: 7,015
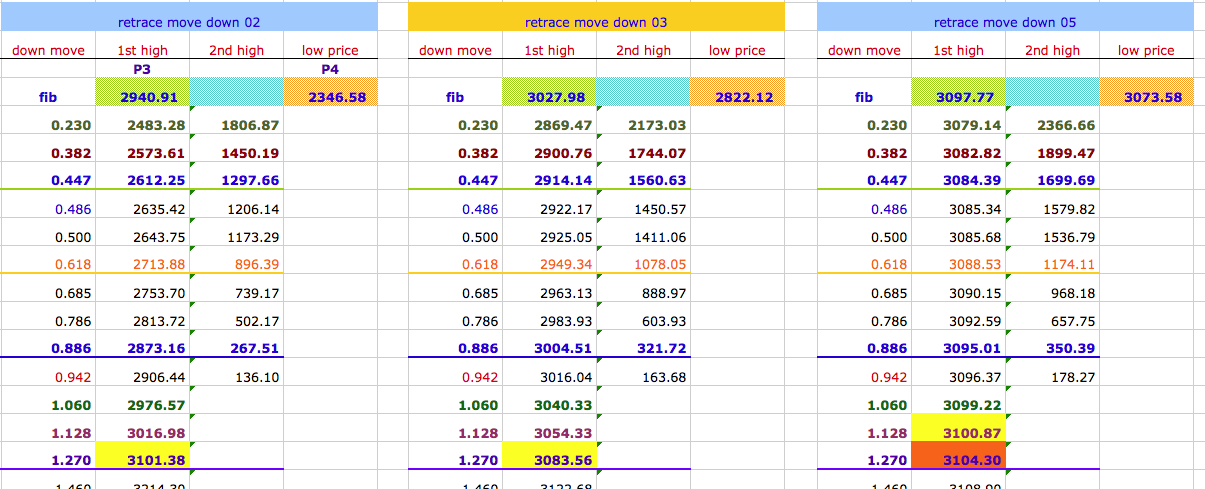
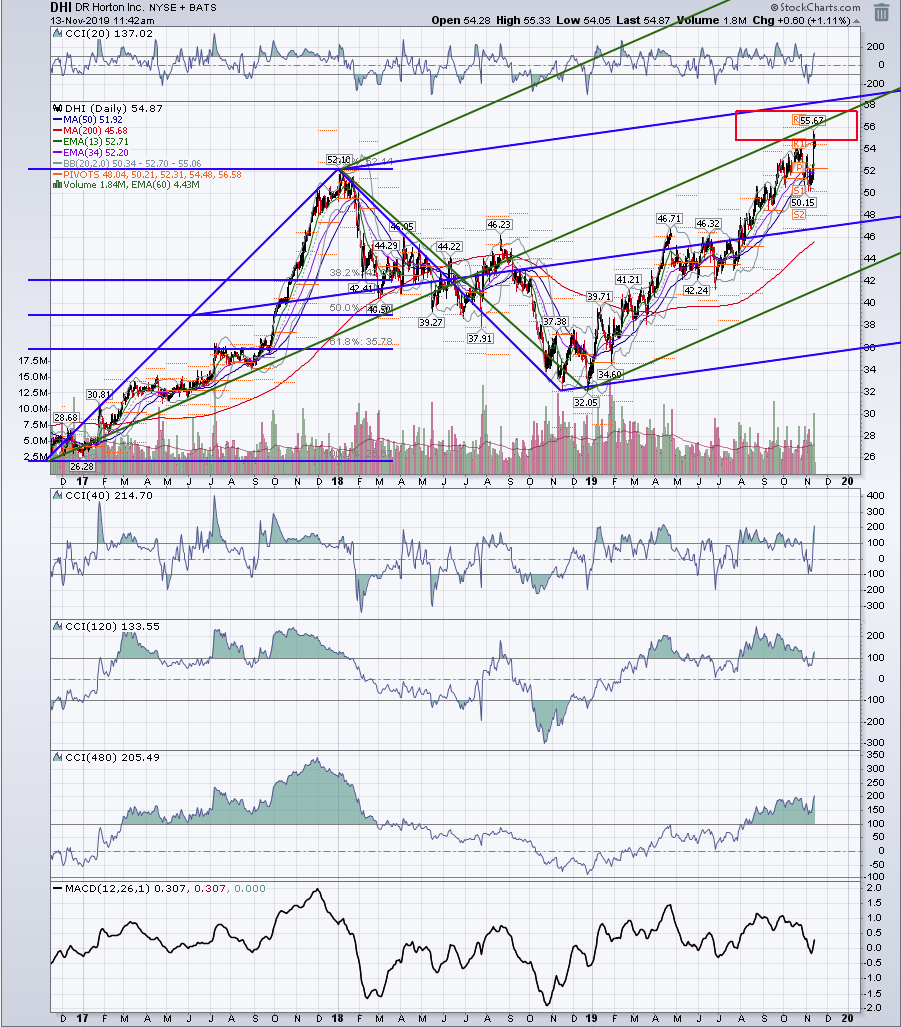
dhi daily - 1.128 - 1.27 external retrace fib box....it's into an interesting area
Click image for original size
screen shot 2019 11 13 at 11 42 25 am png
DU
Duane
Rep: 100
Posts: 1,095
Nice work everyone!!

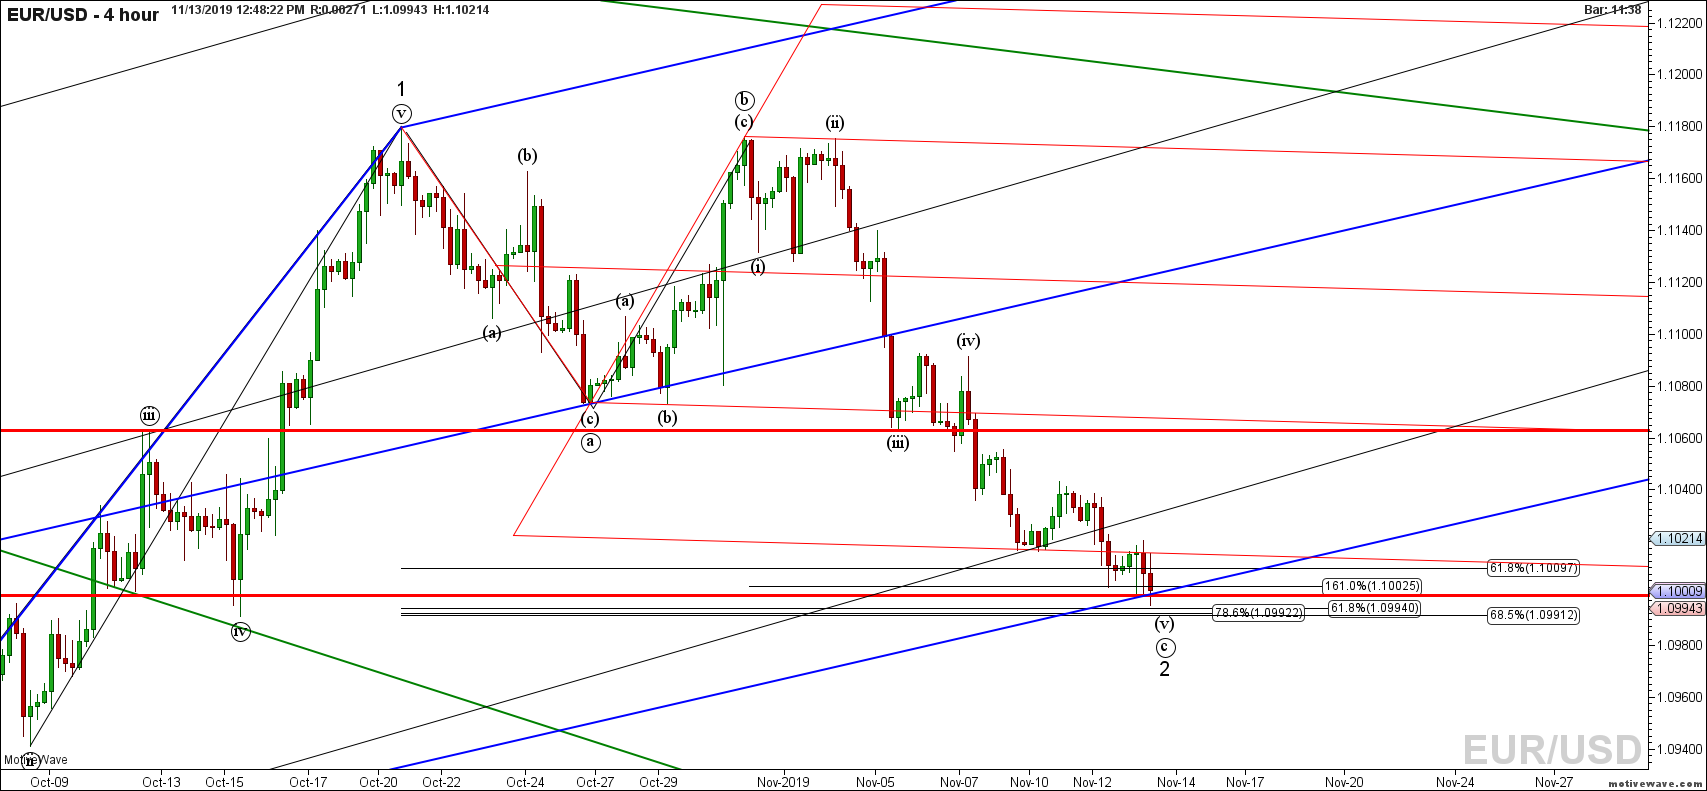
Its go time


Click image for original size
eurusd primary analysis nov 13 1248 pm 4 hour png
AL
albert
Rep: 99
Posts: 3,094
Awesome work, guys.

Al :--)
AL
albert
Rep: 99
Posts: 3,094
Super high-quality analyses, guys.

Al :--)