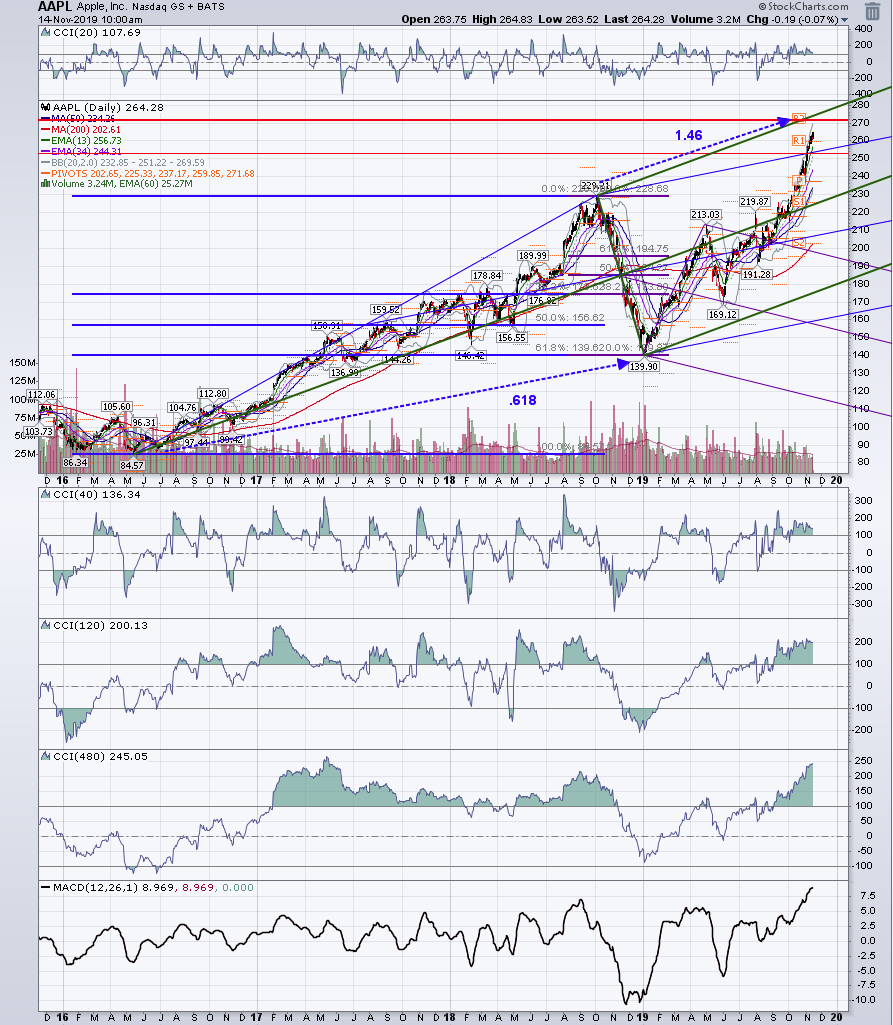
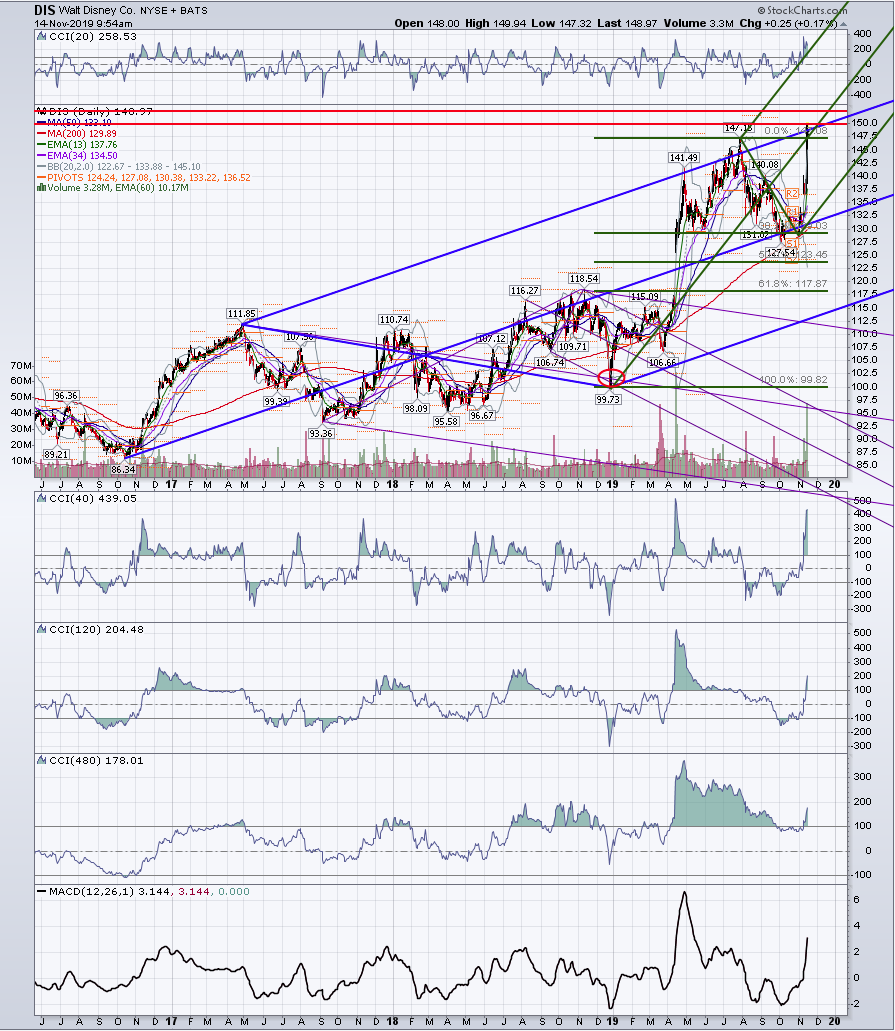
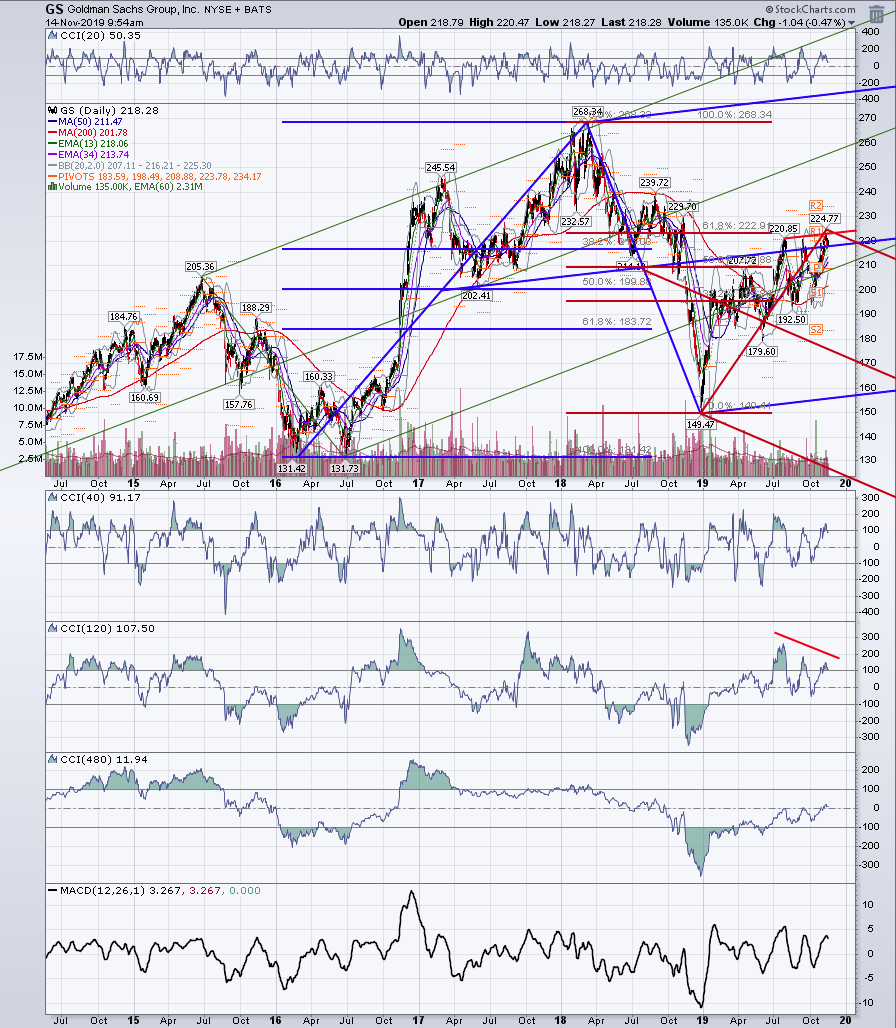
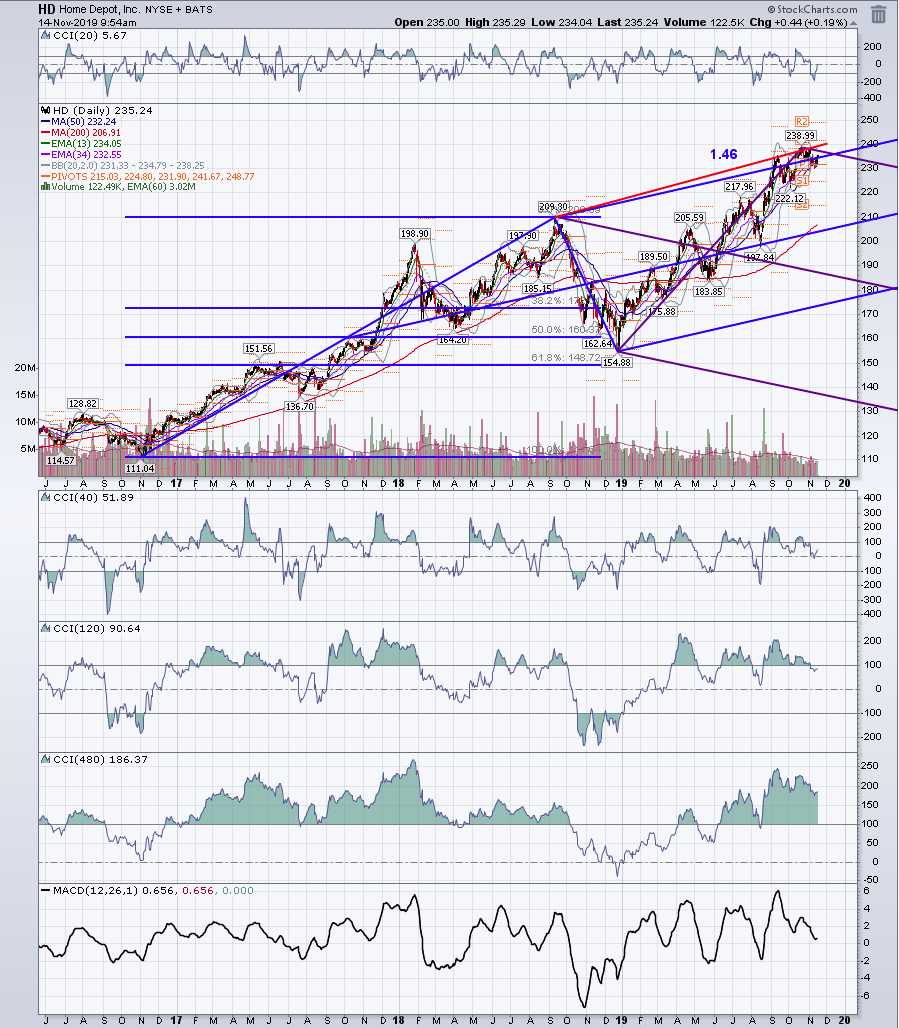
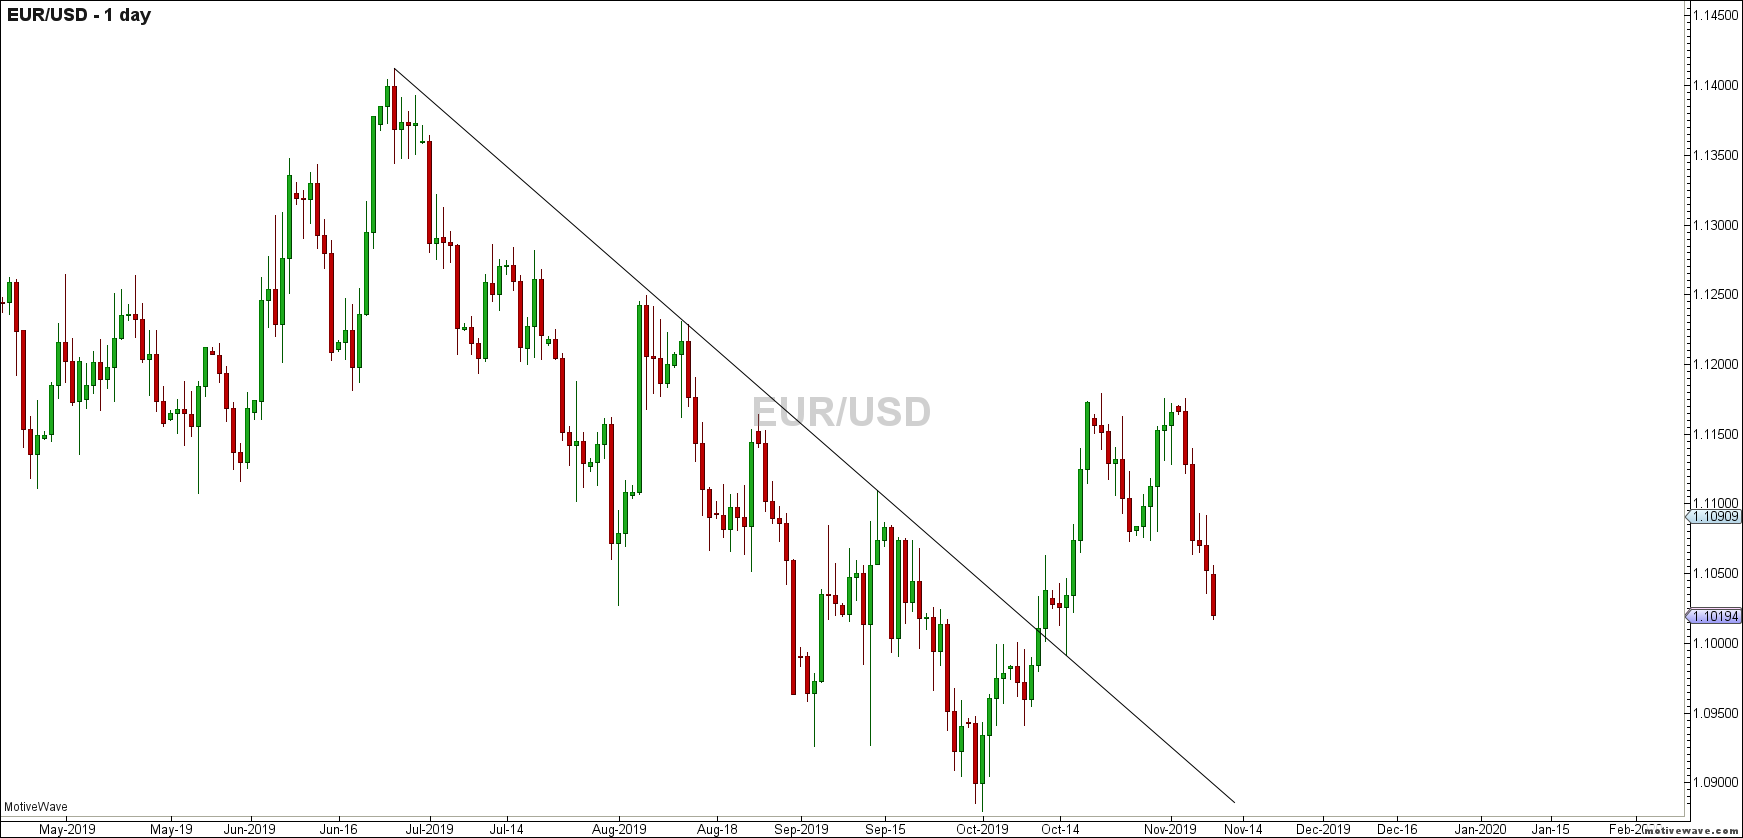
It's Friday night, and I have entered this EURUSD position against my trading plan, ( no trigger ) . And I know that I am going to take some heat because of it. After all the Market is the best teacher. I thought that 146.0 ext plus the lines would be a great place to enter, but alas, the price action is still bearish. This is a classic Double top ABCD, so if not 146.0 the next stop is 161.0 So where are the lines?
Lets start from the beginning. Down trend with break and retest of down trend line.
Click image for original size
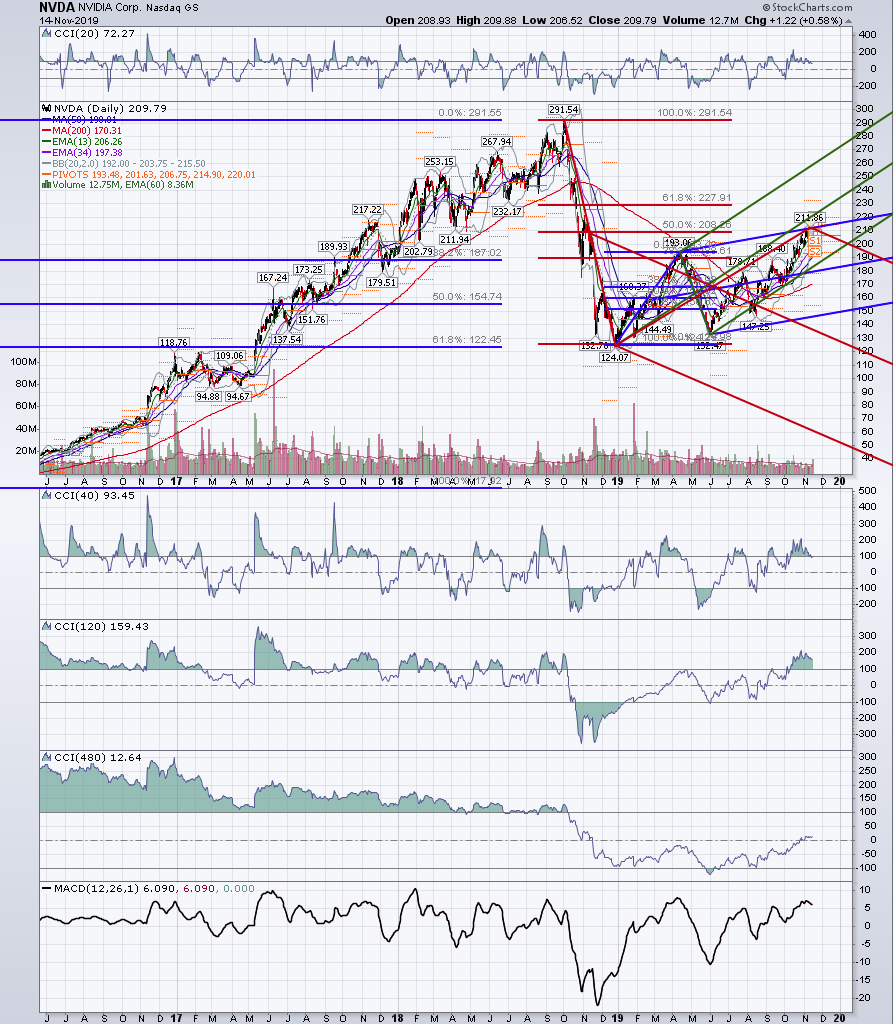
Add fibs and look for confluence and my wannabee wave count
Click image for original size
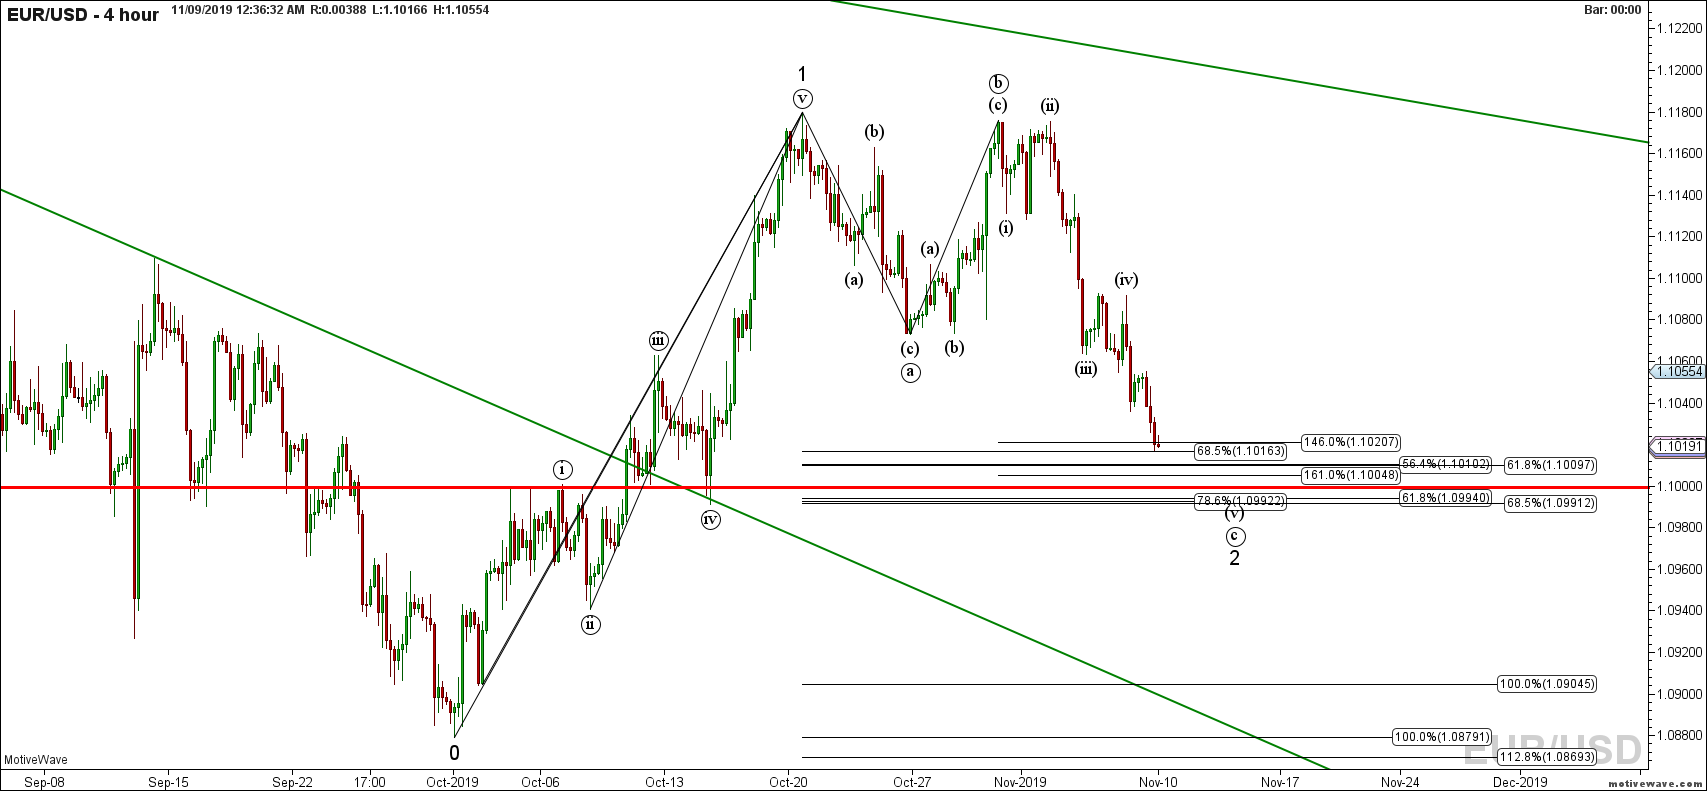
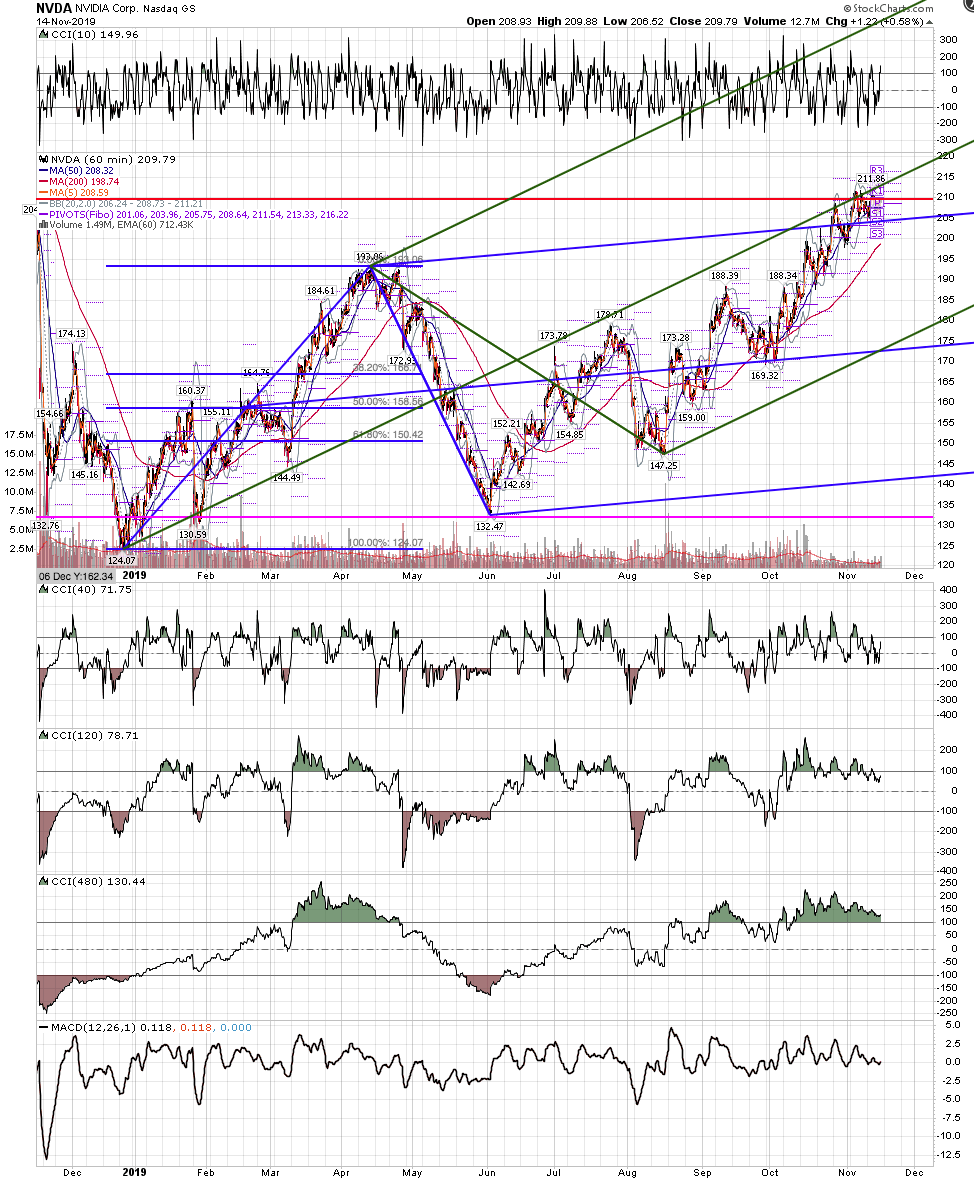
Adding lines, it fits if it stops here, but what if it goes to 161.8 ?
Click image for original size
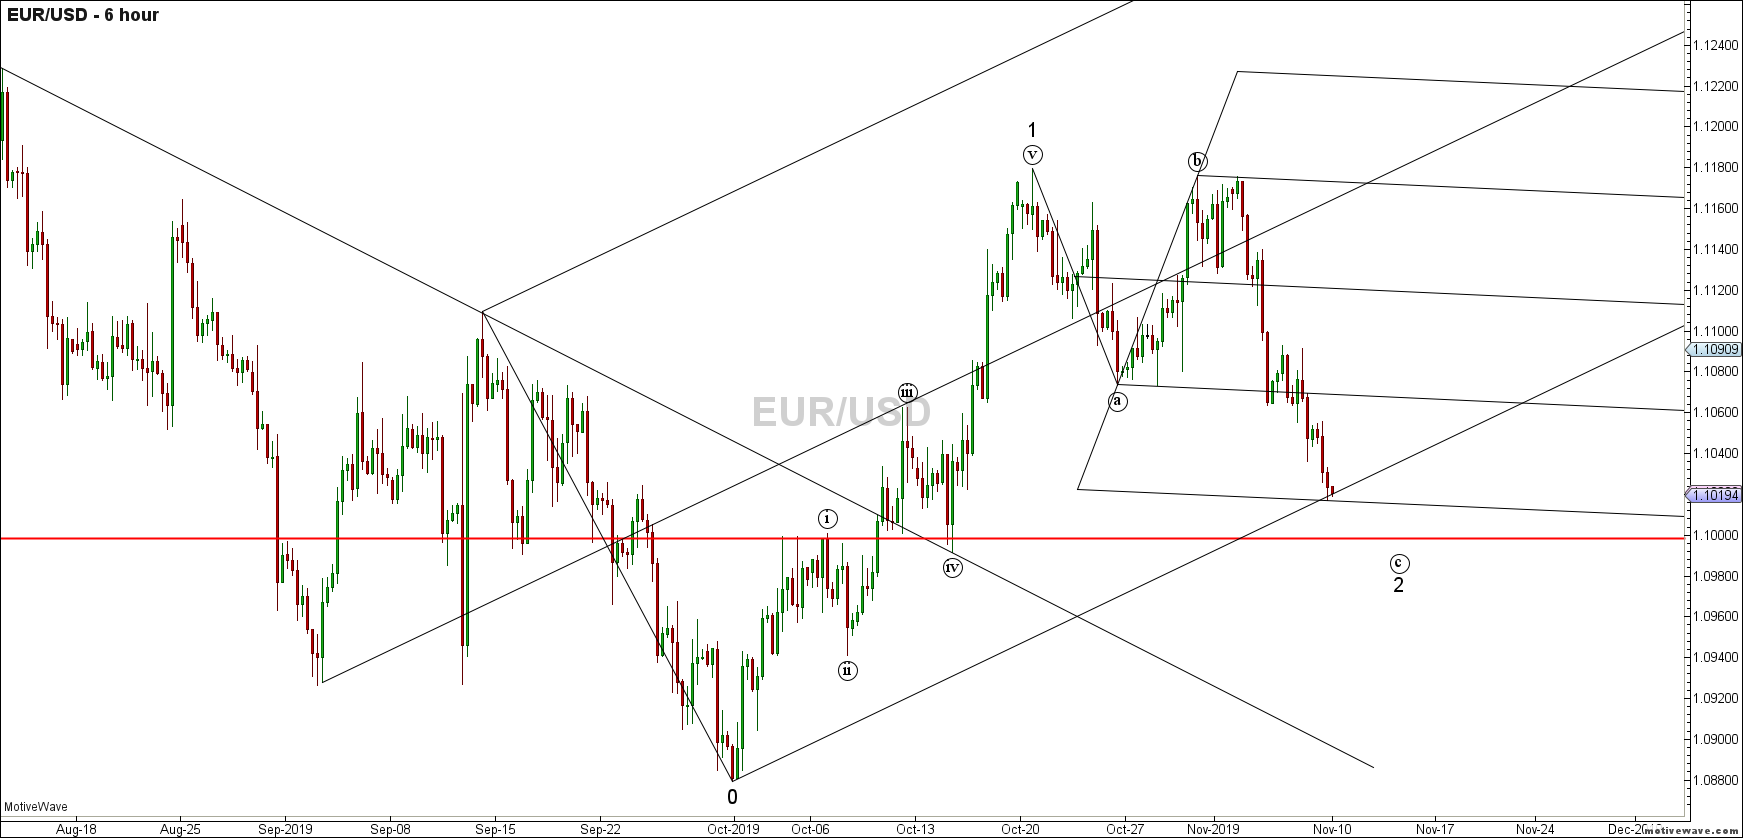
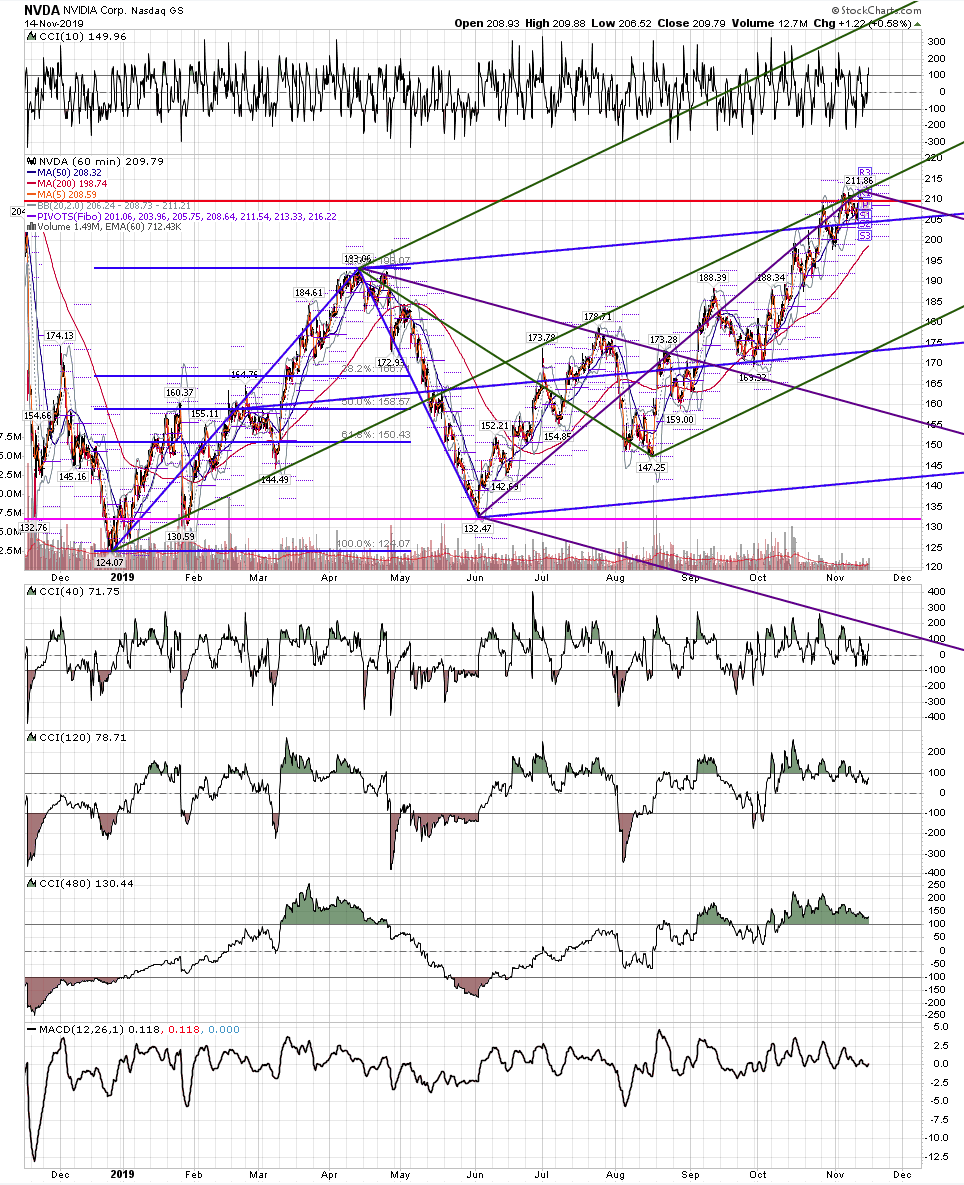
Click image for original size
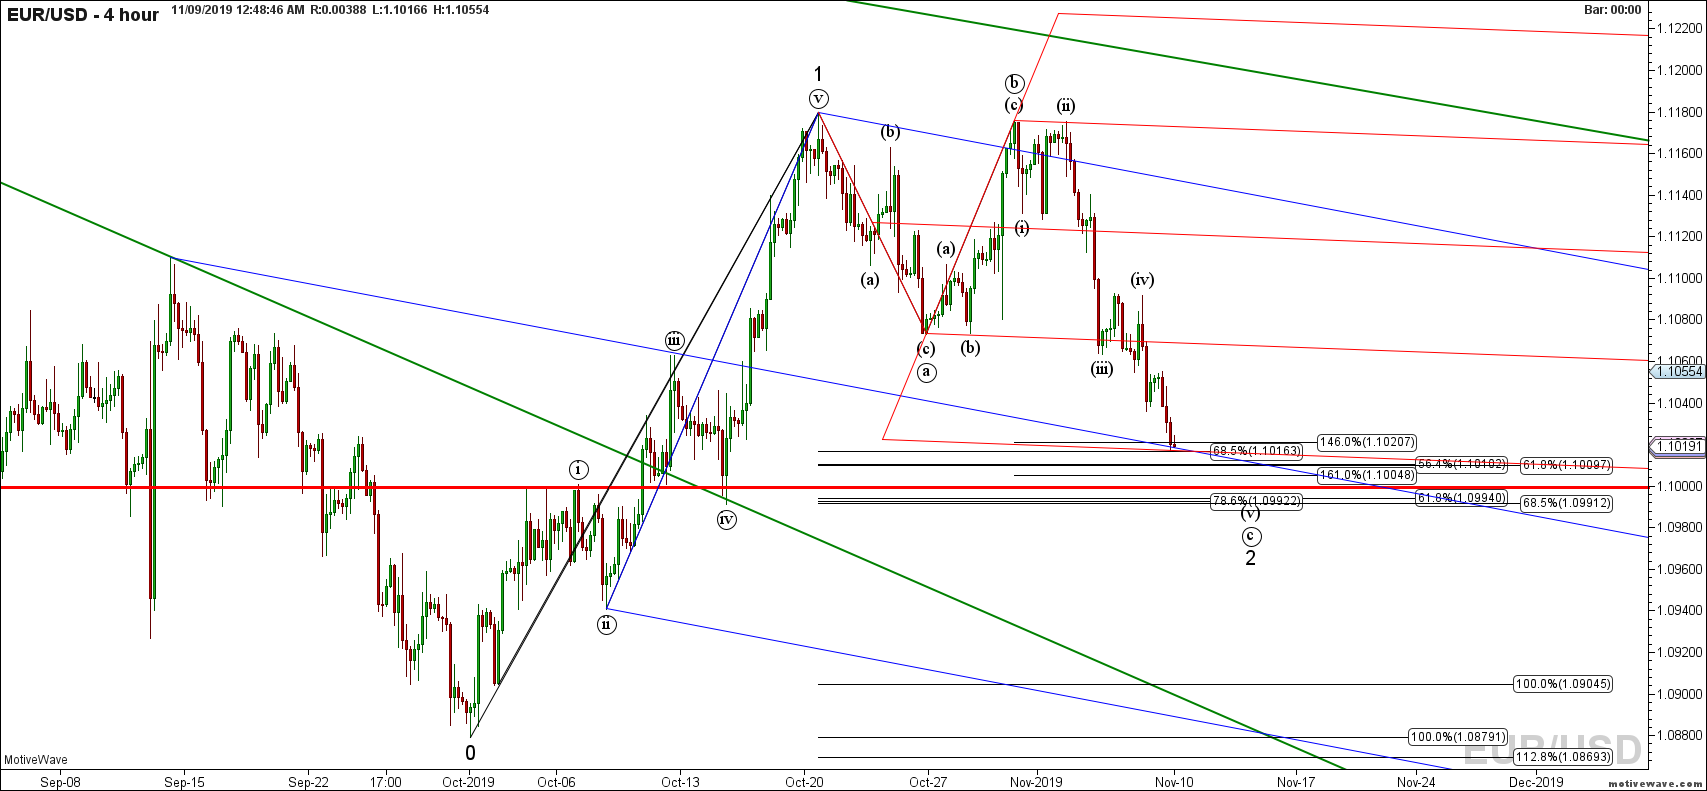
Maybe this blue line ?
Click image for original size
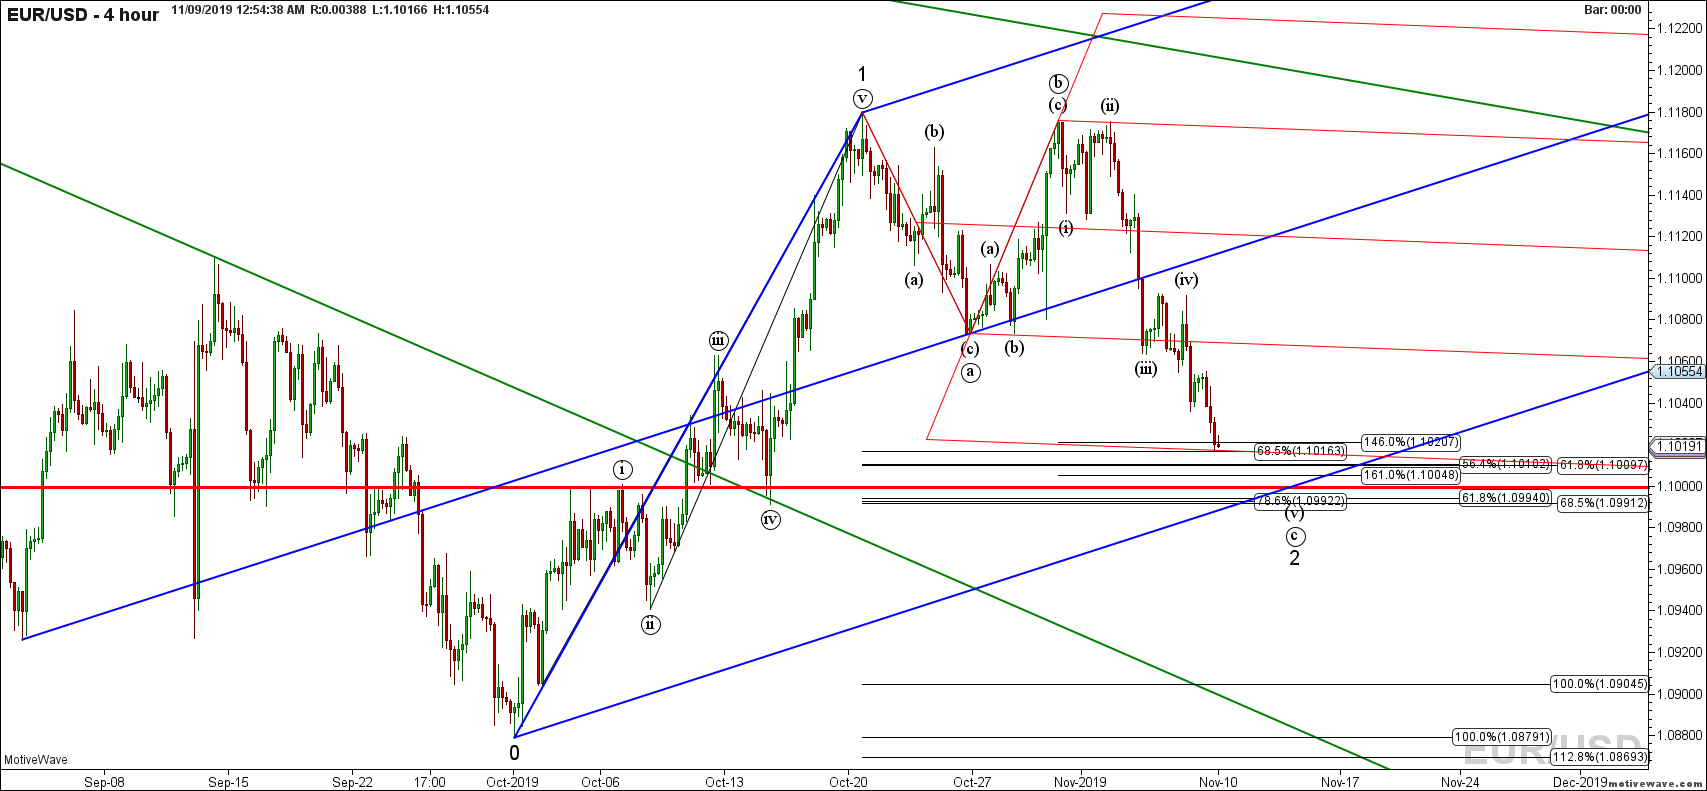
Just thinking out loud while baby sitting my granddaughter.
Have a great weekend guys!!!