A pitbull setup
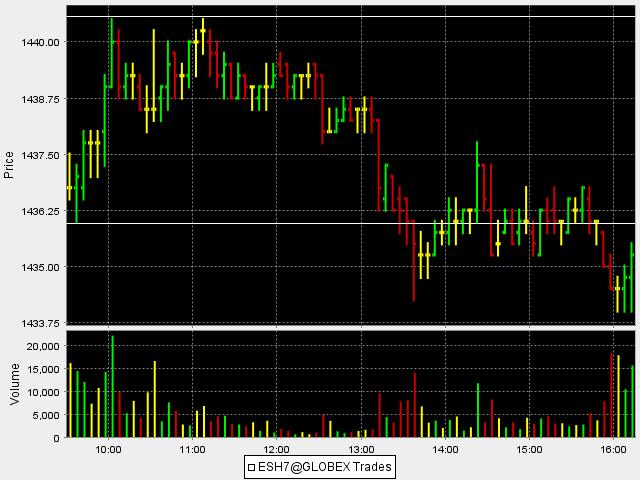
At the request from Max I thought I'd post a little beauty of a setup that I use....It's probably bastardized from somewhere so I won't take complete credit by any means. It is based on a Market divergence between the emini Dow and the emini S&P when they are trading near the extremes of the day ( the highs or the lows) . I will post some basic charts from a demo account ( which sucks because I don't know how to get text on the chart itself) but I won't give away all my secrets..lol...I have traded this method for a long time and some are improving it which is great ... we can also get ideas from some of the great minds on this forum...a few things first 1)I synch the emini dow to start at the same time as the emini S&P...for me that is 9:30 Eastern..I donot display any other earlier dow data....2) I look for the dow to make a new high ( in this example) but not the S&P...then I look to fade...so I will take a short 3) I fade moves and do not play breakouts so in general I sell strength and buy declines..now this may seem too simplistic for most but it is very powerful...The first chart is the emini S&P..Notice the retest of the 10:05 high at 11:10 on lower volume....at this time the Dow actually made a higher high.( see the dow chart)..then the dow again made a higher high at 12:05 too…but look what was happening to the S&P…again not near it;s highs..look at the volume ( or lack of)on the retests..This isn’t a perfect example but it worked for me…...To back test this, the only suggestion I can make is to watch it for a while....
Now look what happens when the S&P is making new lows on the day but not the Dow...so the setups work in reverse too and can be used as a way to take profits... I have drawn trendlines...these entires can be improved by adding the $Tick index ( hint - Max) or something that works for the individual trader...some like to see what the Nasdaq composite is doing..you can even add an indicator.. .There is a way to utilize this method while we are inside the days range but that will be for another post. Hope somebody can understand this simple yet effective setup. And if I ever become a vendor ( which I won't ) I'll supply you with 7 years of statements or more...lol..
Click image for original size
Click image for original size

Now look what happens when the S&P is making new lows on the day but not the Dow...so the setups work in reverse too and can be used as a way to take profits... I have drawn trendlines...these entires can be improved by adding the $Tick index ( hint - Max) or something that works for the individual trader...some like to see what the Nasdaq composite is doing..you can even add an indicator.. .There is a way to utilize this method while we are inside the days range but that will be for another post. Hope somebody can understand this simple yet effective setup. And if I ever become a vendor ( which I won't ) I'll supply you with 7 years of statements or more...lol..
Here is a primer on Divergence if you are new to the concept.
Thanks for the strategy Bruce. I think that divergence is one of the more popular techniques and set-ups that traders use. It is probably also the most difficult (if not impossible) to back test.
Thanks for the strategy Bruce. I think that divergence is one of the more popular techniques and set-ups that traders use. It is probably also the most difficult (if not impossible) to back test.
Your welcome...most think about indicators when it comes to Divergence but I feel that the interplay and the divergences between the major indexes is much more profitable and doesn't suffer ( as much) from the typical issues associated with indicators...perhaps combining the two concepts would provide more accurate signals...
Bruce
Bruce
I think that what you are doing is valid and probably more profitable (as you say) than using indicators. Remember that the top 10 stock (2% by number) in the S&P500 account for 22% of it value because the S&P500 is a value weighted index. Those 10 stock are probably in the DJIA's 30 stocks which is weighted by price and not by value.
You don't need to be rocket scientist to understand the co-relation and relationship that these 2 indices have to each other. By playing the divergence between these 2 indices you are also playing a strategy called Single Sided Arbitrage. i.e. you expect them to come back into sync and you are betting on the one that is going to give and return to normalcy.
You don't need to be rocket scientist to understand the co-relation and relationship that these 2 indices have to each other. By playing the divergence between these 2 indices you are also playing a strategy called Single Sided Arbitrage. i.e. you expect them to come back into sync and you are betting on the one that is going to give and return to normalcy.
Thanks for this insight Guy. Now we just throw in a good entry signal, some proper money management and a bit of luck and over the long term we can make some money...It's a nice entry when you feel that range extension is going to fail for the day...or you run into a resistance area...for this short trade example..
quote:
Originally posted by day trading
By playing the divergence between these 2 indices you are also playing a strategy called Single Sided Arbitrage. i.e. you expect them to come back into sync and you are betting on the one that is going to give and return to normalcy.
The problem that I have found with divergences is that the two things that are diverging can be diverging for a long time before the turning point so timing the entry can be tricky. You get in too soon and you are hanging in there with a big draw down or stop only to see the market turnaround a short while later and make your trade work.
Bruce (or anyone): How do you solve the problem of timing the entry after the divergence has started?
Bruce (or anyone): How do you solve the problem of timing the entry after the divergence has started?
Hi Elite,
I really haven't found this to be true with the method I employ, although I will admit it is far from perfect. Are you refering to two indexes diverging or an indicator and a market? Big diverence...I was hesitant to use the word "Divergence" because most automatically assume it is a price bar and an indicator thing...so please clarify for me...before I ramble on...lol..ok I'm gonna ramble anyway..
The Challenge I have with indicator divergence in general is that you can show a divergence on a one minute time frame ( for example)but on a 5 minute there will be none...I am no math wiz but I assume since most oscilators ( i also can't spell) are derived on price and usually use the closing price then in theory we could ( out of a 5 minute bar) have 4 one minute bars with down closes and then the fifth bar closes up above them all... so depending on your settings there may be a divergence on the one minute but not the five minute...I think indicator divergences are over-rated..
Bruce
quote:
Originally posted by elite trader
The problem that I have found with divergences is that the two things that are diverging can be diverging for a long time before the turning point so timing the entry can be tricky. You get in too soon and you are hanging in there with a big draw down or stop only to see the market turnaround a short while later and make your trade work.
Bruce (or anyone): How do you solve the problem of timing the entry after the divergence has started?
I am talking about big divergence. If you are trading the YM and the ES drops below its low of day and the YM does not (as in your example) then at what point do you buy the YM? As soon as the ES dips below the LOD or do you wait some and if so what is that "some" ?
I average into trades and only trade the ES but to answer your question: I donot usually wait, I like to see a big volume flush with some good low TICK reading or divergence in Ticks..then I initiate.....You can also use a trade above the high of the low bar to initiate long but then we get into the question of which time frame to use for that particular entry...I never met anyone who can consistently call tops and bottoms and that is why I average in. I also have an "Uncle" point where I will pull the plug if I am wrong....
Thanks for the clarification. What is an "Uncle" point?
I'd also like to point out another concept . You will notice that the YM droped below yesterdays low and at the same time the ES didnot. This was at about 10:12 or so....Remember I only view the YM from the 9:30 so it was the 9:30 low from yesterday that I refer to.. Then the market popped up...I point this out for reference only..Ticks where only registering a minus 225 ( about ) at this time too........seems like Ticks spending a lot of time on upside today.....I will be surprised if the market doesn't try to roll up....but we;ll see
Emini Day Trading /
Daily Notes /
Forecast /
Economic Events /
Search /
Terms and Conditions /
Disclaimer /
Books /
Online Books /
Site Map /
Contact /
Privacy Policy /
Links /
About /
Day Trading Forum /
Investment Calculators /
Pivot Point Calculator /
Market Profile Generator /
Fibonacci Calculator /
Mailing List /
Advertise Here /
Articles /
Financial Terms /
Brokers /
Software /
Holidays /
Stock Split Calendar /
Mortgage Calculator /
Donate
Copyright © 2004-2023, MyPivots. All rights reserved.
Copyright © 2004-2023, MyPivots. All rights reserved.