KO
koolblue
Rep: 48,651
Posts: 16,032
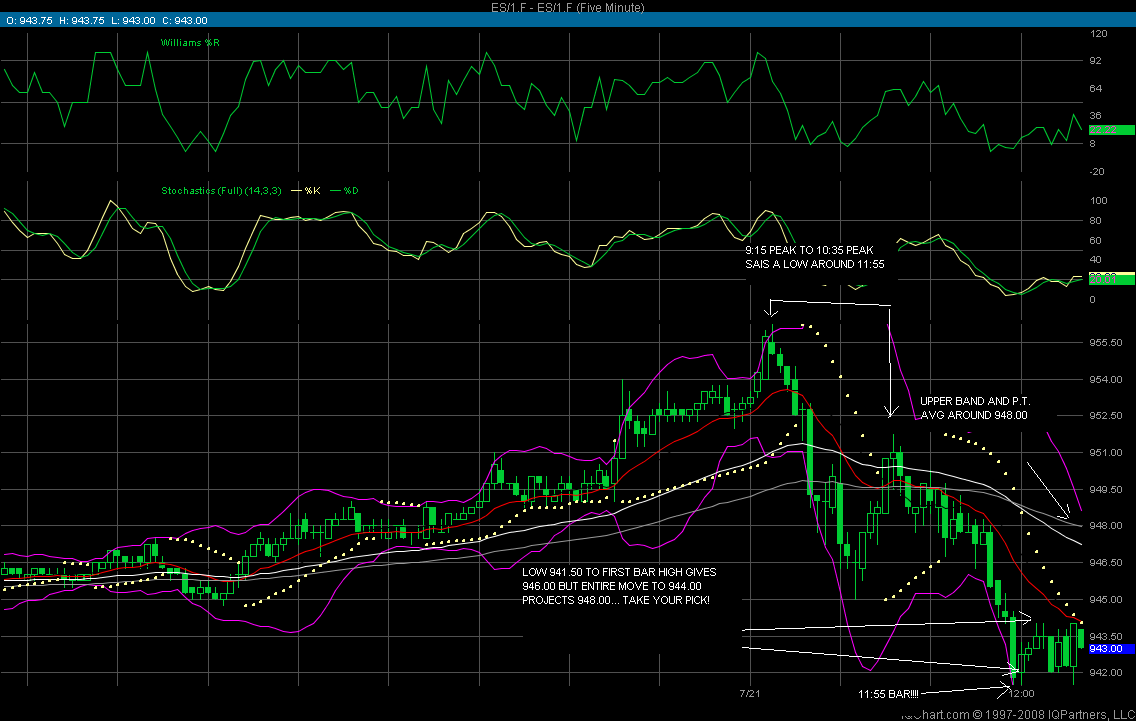
Well, the picture is becoming clearer, a decent decline here, and then higher....much higher into july! heres what Kools Tools are saying F.W.I.W.!
KO
koolblue
Rep: 48,651
Posts: 16,032
well not much of a bounce! (bearish?)... any way check this out!.....
Click image for original size

....KO
koolblue
Rep: 48,651
Posts: 16,032
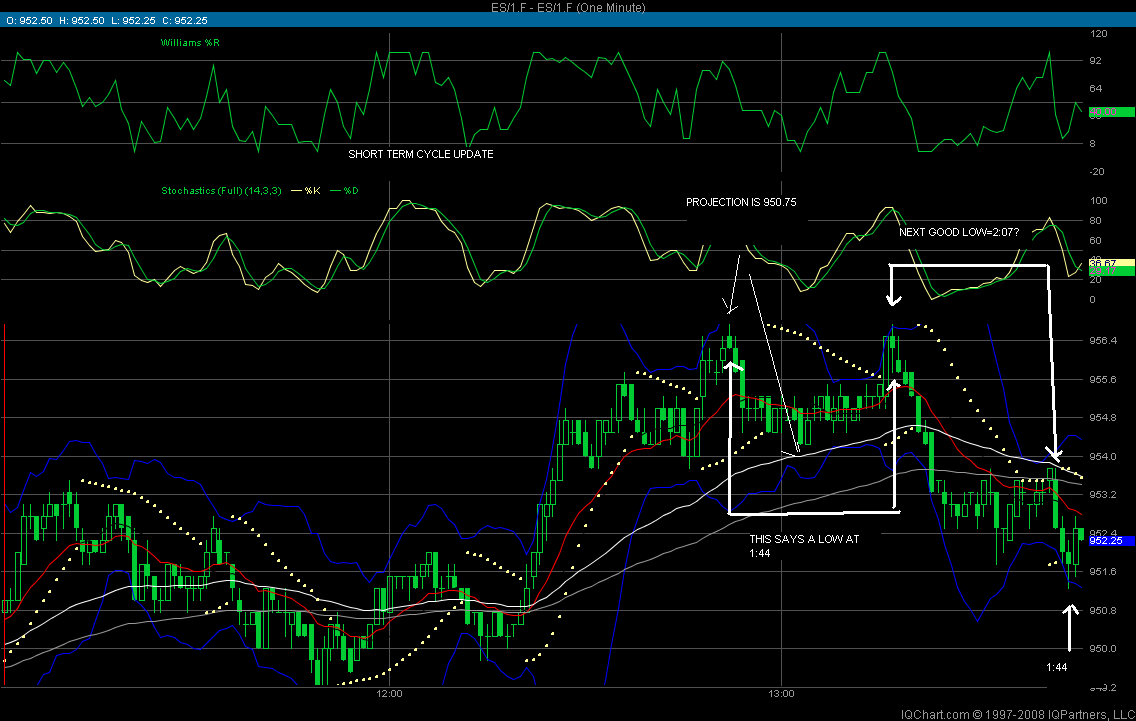
i know ,i know... you saw the chart about the LOW not high due the 22nd and said..impossible! were too overbought! and you probably laughed when i posted the chart showing the phenomenon i call Kools monthly which said any buy on the 22nd would be profitable..... still laughing?
KO
koolblue
Rep: 48,651
Posts: 16,032
these are likely my last posts... the above chart was posted yesterday in my room


KO
koolblue
Rep: 48,651
Posts: 16,032
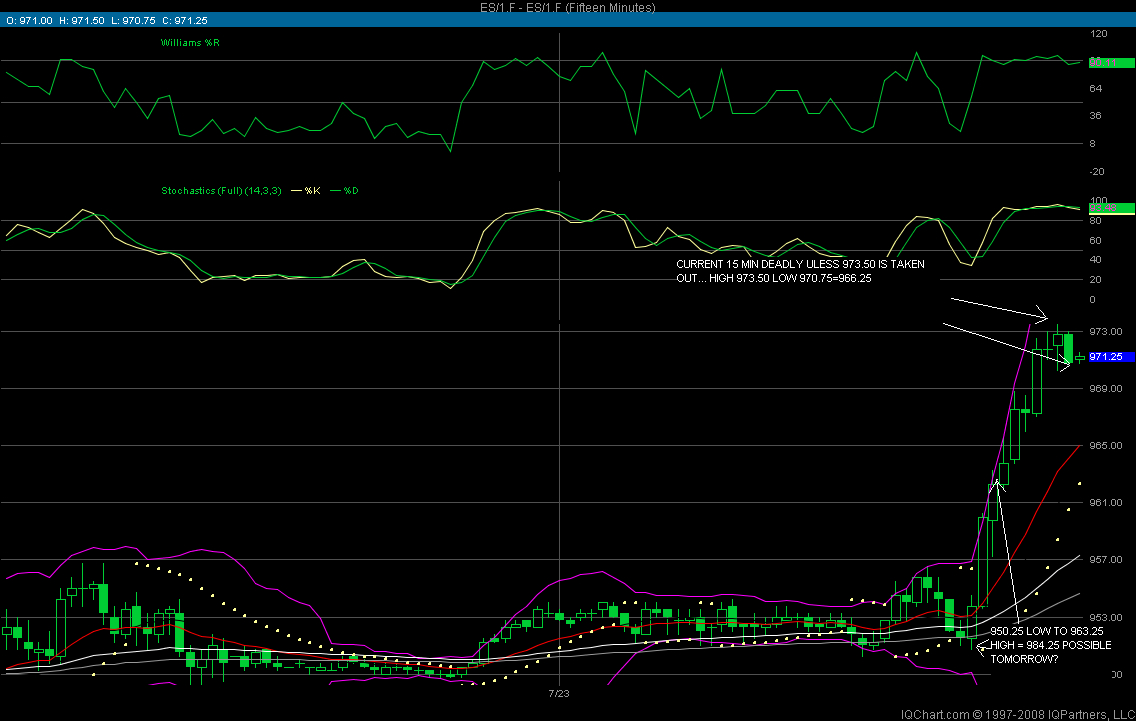
AND FINALLY!!!! 972.25 AREA OR 984.25 ZONE
Click image for original size

ST
stocksster
Rep: 1,303
Posts: 181
kool, there's a separate thread that has been opened here, in search of you...
http://www.mypivots.com/forum/topic.asp?TOPIC_ID=4789
http://www.mypivots.com/forum/topic.asp?TOPIC_ID=4789