ES 12-05-08
GOOD MORNING ALL! Well as you know im not a big fan of longer term forecasts, but i keep getting asked so much that thats why i posted some views the other day on the globex thread and the trading strategies forum. I bring it up not to receive plaudits but because im trying to 'teach' you that the techniques i have shown you here(price proj. and cycles) work on any time frame and in any market for that matter! I have always made good money from the markets but my dream has always been to create an 'army' of traders as skilled (or better!) as i am to level the playing field at this giant casino we call the financial markets. When i made the case for a top in the market tue-wed with 872.50-877 being the prime resistance area im sure most were skeptical, and heck, coming off of the most oversold market in history thats understandable.
selling 836.25 if we get there
sorry more like 835.50
Prestwick, I don't
yeah Palmer i see that too.... PREST I just noticed your original projection is the 'deadly' 15 min!! CONGRATS.. (THE STUDENT HAS BECOME THE MASTER) roflquote]Originally posted by prestwickdrive
the previous cycle high of 28.5 less the last cycle low of of 19.5 times 2.618, added to the cycle low, projects to 43.0 doesn't it? Am I oversimplifying?
the previous cycle high of 28.5 less the last cycle low of of 19.5 times 2.618, added to the cycle low, projects to 43.0 doesn't it? Am I oversimplifying?
yes you are right- looks like a test of highs- 841.50 area
buying 2 at 831 if they let me
Quick question guys...
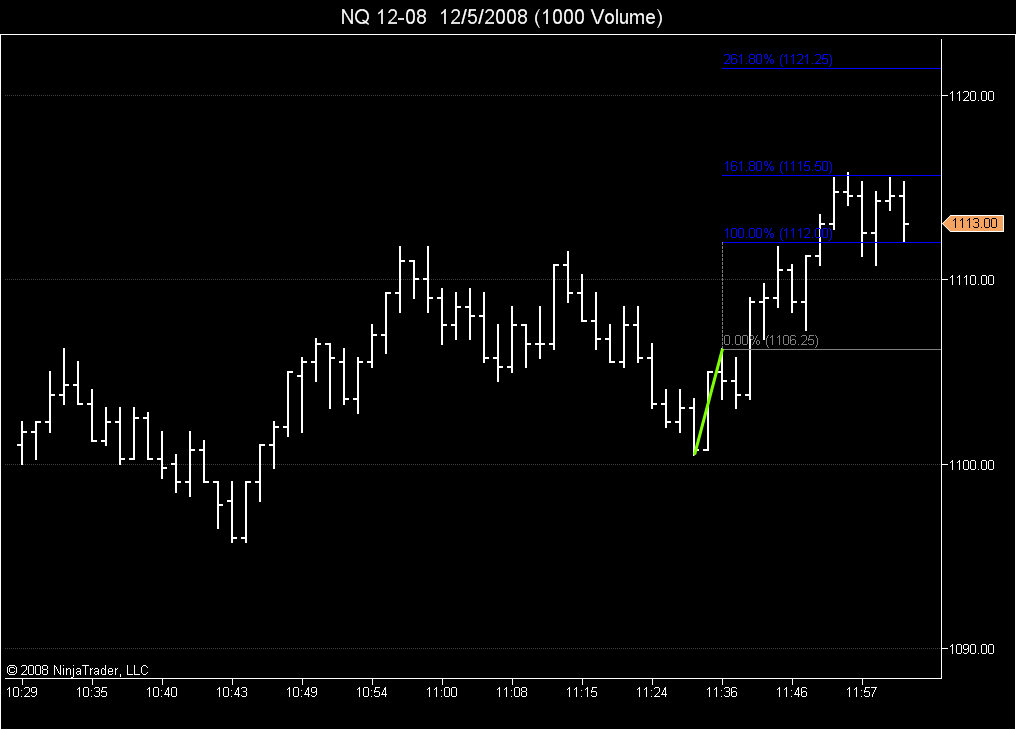
I was fooling around with the fibo extension technique Koolblue uses and has been teaching. On my NQ chart I noticed the following and was wondering if I am applying the technique correctly ? Thanks for your help...
The yellow line is the initial thrust in the new up trend, which I use to make the fibo projections. Note the first stall occurred at the 100% projection level, and the second stall occurred at the 161.8 projection level...
Click image for original size
LOL Kool - I am a perpetual victim of the paradox of knowledge in that the more I know the more I know I don't know. I sure like learing though so thanks again to you and all here.
Trin had gottes high as 66.54. In the last 30 min has dropped to 64.59
Welcome to the forum UKtradergirl
These dynamic charts (volume and tick charts) take a little getting used to at first. VO uses a 610 tick chart which matches my volume chart fairly closely.
These dynamic charts (volume and tick charts) take a little getting used to at first. VO uses a 610 tick chart which matches my volume chart fairly closely.
Emini Day Trading /
Daily Notes /
Forecast /
Economic Events /
Search /
Terms and Conditions /
Disclaimer /
Books /
Online Books /
Site Map /
Contact /
Privacy Policy /
Links /
About /
Day Trading Forum /
Investment Calculators /
Pivot Point Calculator /
Market Profile Generator /
Fibonacci Calculator /
Mailing List /
Advertise Here /
Articles /
Financial Terms /
Brokers /
Software /
Holidays /
Stock Split Calendar /
Mortgage Calculator /
Donate
Copyright © 2004-2023, MyPivots. All rights reserved.
Copyright © 2004-2023, MyPivots. All rights reserved.