ES 12-05-08
GOOD MORNING ALL! Well as you know im not a big fan of longer term forecasts, but i keep getting asked so much that thats why i posted some views the other day on the globex thread and the trading strategies forum. I bring it up not to receive plaudits but because im trying to 'teach' you that the techniques i have shown you here(price proj. and cycles) work on any time frame and in any market for that matter! I have always made good money from the markets but my dream has always been to create an 'army' of traders as skilled (or better!) as i am to level the playing field at this giant casino we call the financial markets. When i made the case for a top in the market tue-wed with 872.50-877 being the prime resistance area im sure most were skeptical, and heck, coming off of the most oversold market in history thats understandable.
flat 62.50
covered 863.00
BOOM!!
now up 12.25 and chillin..proj down was and still is 861.25
candy from a baby! 261.8% auto sell auto $$
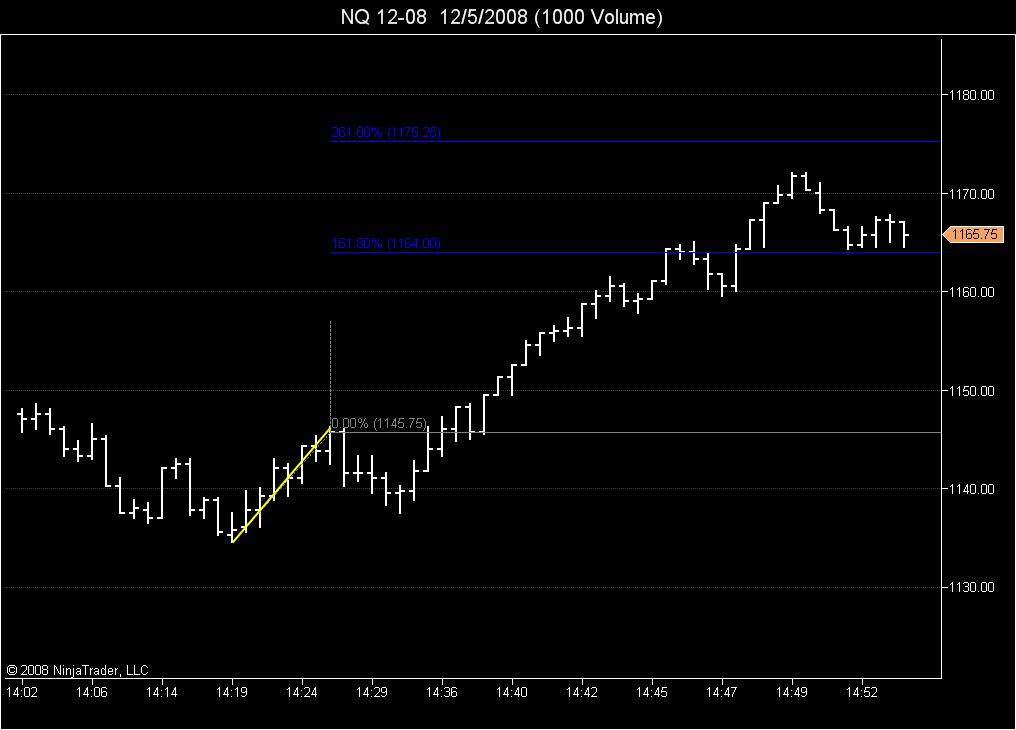
Click image for original size

that 161.8 projection in the NQ acts like a magnet on the 1000V chart...
Click image for original size
i have 2:58-3:00 for a mini peak ..remains to be seen it it happens PLEASE, PLEASE, ENOUGH APPLAUSE ALREADY...ROFL!!
PT, What charting service? (when u get time)
pt I think you will find it acts that way with tick/volume/time it dont matter - it just works!
never mind ,just saw the logo!
Welcome to the forum UKtradergirl
These dynamic charts (volume and tick charts) take a little getting used to at first. VO uses a 610 tick chart which matches my volume chart fairly closely.
These dynamic charts (volume and tick charts) take a little getting used to at first. VO uses a 610 tick chart which matches my volume chart fairly closely.
Emini Day Trading /
Daily Notes /
Forecast /
Economic Events /
Search /
Terms and Conditions /
Disclaimer /
Books /
Online Books /
Site Map /
Contact /
Privacy Policy /
Links /
About /
Day Trading Forum /
Investment Calculators /
Pivot Point Calculator /
Market Profile Generator /
Fibonacci Calculator /
Mailing List /
Advertise Here /
Articles /
Financial Terms /
Brokers /
Software /
Holidays /
Stock Split Calendar /
Mortgage Calculator /
Donate
Copyright © 2004-2023, MyPivots. All rights reserved.
Copyright © 2004-2023, MyPivots. All rights reserved.