Support Resistance
Support/Resistance (S/R) price levels
This is an example of how I look at the charts to draw in S/R lines. I refer to them as “Price Action” support/resistance levels or prices. Each line, while it denotes a specific price, is actually a zone … give or take a few ticks above and below it.
I thought I’d post a chart with the PASR (Price Action Support Resistance) levels and share what I see when I draw them in as a “map” for the next day’s trading session. Ain’t nothing new here really. Just wanted to provide a picture of why I choose the price levels that I do. And, as always, they’re just potential inflection prices where the market may react in a way that offers a trade to fade into a particular price zone.
I look at 1m, 5m, 15m, 30m, 60m and daily bar charts to fine tune it as best I can with my own discretion. Some levels are more significant than others and it always depends on whether the day unfolds into a trend day or a range type of trading session. The trades I wait for are around these levels typically, and also depend on how price is reacting when it reaches and trades around them. I also take into account other factors such as the $TICK chart and also being aware of other market indices as well as the weekly and daily “floor pivots” … looking for confluence or a tight clustering of several of these together at a certain PASR level.
Anyway, I thought I’d post my chart analysis for the PASR levels using a 60m chart with circled areas showing what stood out to me as I viewed the “picture” of trading. It shows why and where I draw in potential PASR levels or ZONES that I can anticipate (not predict) where the market may offer a decent low risk trade.
Like I said … ain’t nothing new here … no reinvention of the wheel. But it’s how I see the S/R wheel with my own eyes. Everyone has a different set of peepers looking at the same thing and may arrive at similar or even very different levels.
So, here’s what I’m seeing now for Monday (using RTH for analysis here). I’d love to have others offer what they see and why with posted charts and their analysis. Obviously MP and other approaches come at things from a different angle. I don’t look at volume at all when drawing in the price lines (for better or worse). So take a look and see if what I’ve got makes sense or not and jump in to share your own … whatever type of analysis you employ for “mapping” anticipated price action coming into the next trading session.
Click image for original size
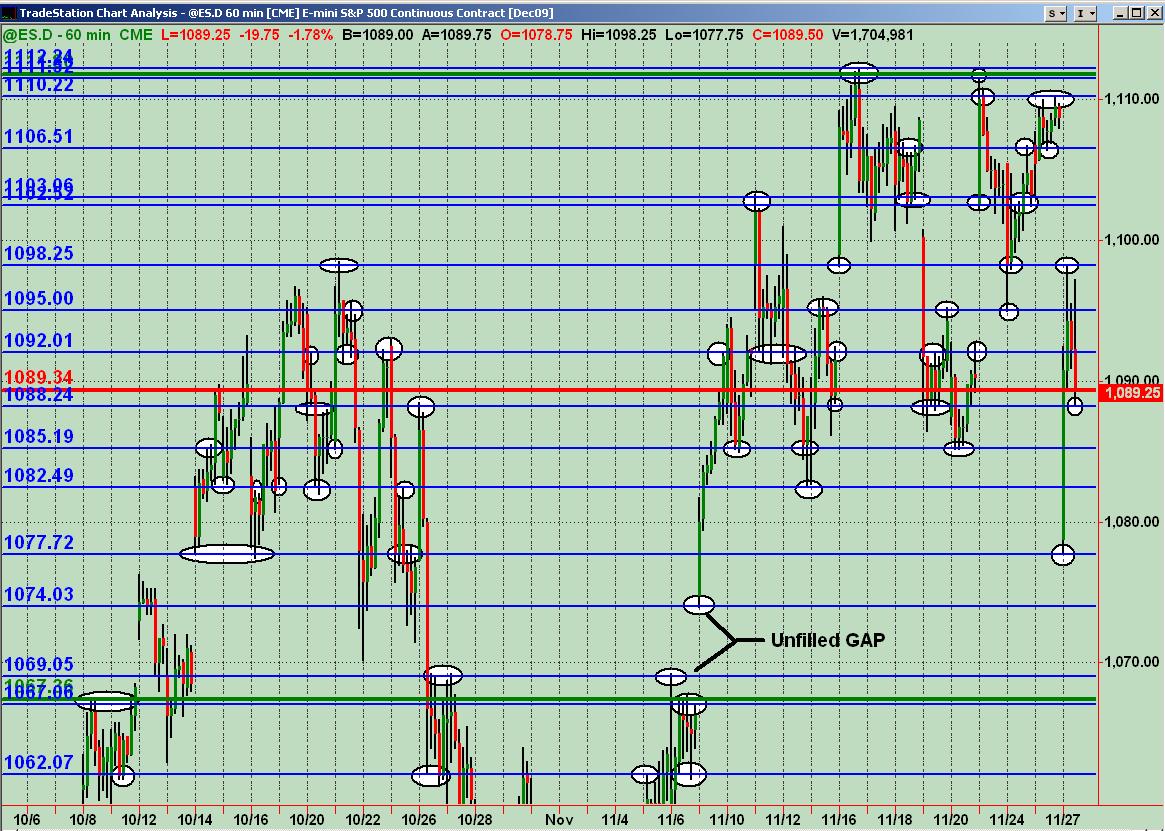
Btw ... should've pointed out that the Red line is Wkly Mid Pvt and Green lines are Wkly R1 and S1 ... the Blue lines are the PASR levels for the ES.
Tried to edit but site wouldn't allow it ... so gotta post again. Just realized that I had roughly 55 "circled" areas on that chart above but could have pointed out more that led me to draw the lines where I did.
Also, if there are 2 blue lines within a couple of points of each other ... that is typically to be taken as a ZONE between the two. Hope my turkey eating addled brain is making a tad bit of sense here!
Also, if there are 2 blue lines within a couple of points of each other ... that is typically to be taken as a ZONE between the two. Hope my turkey eating addled brain is making a tad bit of sense here!
I think the knee-jerk reaction to the Dubai drop has completed, this week we should see the real direction.
Normally I don't like to use range charts, but IB screwed up my datafeed on Thurs. evening/Fri morning, so range charts was the only way to see everything.
The blue bars at the right of the chart are intended to be price targets/magnets, though i recognize some of them coincide with s/r levels.
Click image for original size
Normally I don't like to use range charts, but IB screwed up my datafeed on Thurs. evening/Fri morning, so range charts was the only way to see everything.
The blue bars at the right of the chart are intended to be price targets/magnets, though i recognize some of them coincide with s/r levels.
Great post on your methodology, MM.
I also look for confluence of s/r levels, derived from fibs, pivot points, daily EMA's, and volume profiles.
The latest idea i've been tinkering with is the 5d MA of POC. Right now, it is at 1098.6, which is interesting to me, and also close to where i've highlighted the red line in my chart.
I also look for confluence of s/r levels, derived from fibs, pivot points, daily EMA's, and volume profiles.
The latest idea i've been tinkering with is the 5d MA of POC. Right now, it is at 1098.6, which is interesting to me, and also close to where i've highlighted the red line in my chart.
I'm hoping to have some charts up later...Watching the 1103 - 1105 97, 91 and 84 areas......those have been the volume attractors for so long and the overnight obeying them well...good luck today
Thanks for the chart and analysis Phileo. Maybe I missed it, but how did you derive the cyan/blue lines that you referred to on the right side of the chart?
Didn't trade any futures today ... had done some stock analysis this weekend ... tinkering around. Went thru a couple thousand charts and drilled down to find a few that looked good long. Also, noticed that a lot of the individual stock charts were starting to look messy fwiw.
Didn't trade any futures today ... had done some stock analysis this weekend ... tinkering around. Went thru a couple thousand charts and drilled down to find a few that looked good long. Also, noticed that a lot of the individual stock charts were starting to look messy fwiw.
Hey folks! Talking to those that regularly or even occasionally post ... but more importantly to those who are here visiting regularly but, for whatever reason, don't post.
There's no right or wrong in the end ... when it comes to posting what your trading analysis approach is to the market. I encourage you to post here with a chart and explanation of how you "look" at the market for when, where and how you trade. It ain't about a bunch of traders here waiting to machine-gun your post.
It's all about sharing ideas ... and I ask right here and right now ... for folks who haven't posted anything to share something here. Don't worry about anything ... just POST!!! I don't care if you're just starting out or if you've been trading for decades.
You may discover that the interaction here on this thread is helpful to others ... and with further interaction may even be benificial to everyone. So let the posting and analysis begin in earnest!!!
Originally posted by MonkeyMeat
Thanks for the chart and analysis Phileo. Maybe I missed it, but how did you derive the cyan/blue lines that you referred to on the right side of the chart?
1103-1104 => confluence of 11/24 VPOC + 11/25 RTH LoD
1089-1090 => gapfill of 11/27
1085-1086 => confluence of 11/27 VPOC + 11/27 pp
I get the feeling that there just isn't much interest here...I'm not sure if it is the "seasoned" nature of our forum members or the fact that most like to see indicators and fancy bells and whistles.
It seems most newbies concentrate on entry patterns.....anyway, I'm short at 1104.25 in the overnight which is usually not the greatest place for me.......1103 - 1105 was another Volume area I've been watching...Unfortunately my laptop messed up my charts that I had snapped....they weren't anything fancy and merely showed what happens following the volume thrusts on most days...they get tested...97 - 98.75 is another key and we have overnight volume there too...so that will be the target if I get lucky....
If I had a choice I'd just follow the RTH volume area that are created from previous days and incorporate the overnight to confirm the RTH area....
Emini Day Trading /
Daily Notes /
Forecast /
Economic Events /
Search /
Terms and Conditions /
Disclaimer /
Books /
Online Books /
Site Map /
Contact /
Privacy Policy /
Links /
About /
Day Trading Forum /
Investment Calculators /
Pivot Point Calculator /
Market Profile Generator /
Fibonacci Calculator /
Mailing List /
Advertise Here /
Articles /
Financial Terms /
Brokers /
Software /
Holidays /
Stock Split Calendar /
Mortgage Calculator /
Donate
Copyright © 2004-2023, MyPivots. All rights reserved.
Copyright © 2004-2023, MyPivots. All rights reserved.