ES Wed 8-17-11
Looks like a classic Market Profile play this morning to the tick. The market opened above the value area at 1196.75 and then traded down to 1195 even which was 1 tick below the VAH (1195.25) which would have been a buy signal. Subsequent to that it has traded as high as 1206.25. So far:
Draw down: 0.25 points
Best run up: 11 points
Draw down: 0.25 points
Best run up: 11 points
Click image for original size
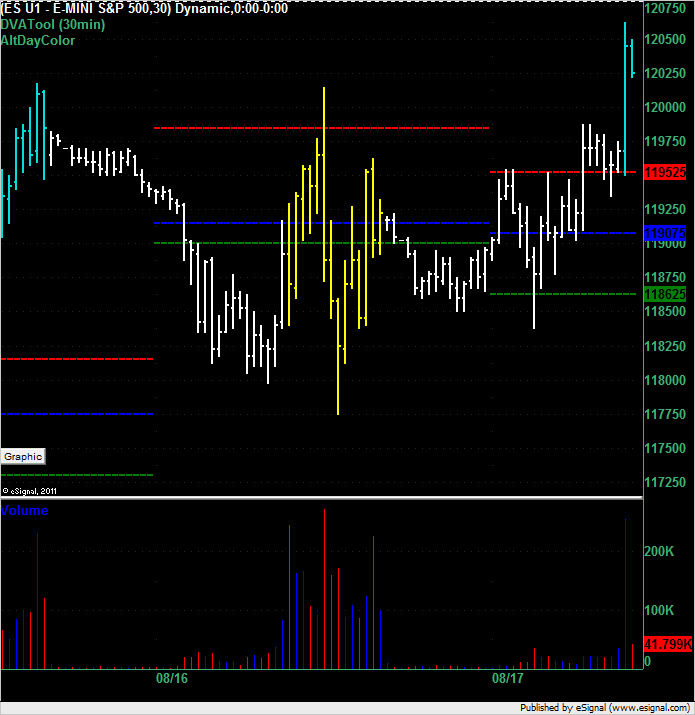
98.75 was the high of VAH of yesterday
yest's volume POC hit - 1190
OVernight volume (Value Area) is taken out. I think this is "mission accomlished".
The following chart is a split between O/N (left) and RTH (right)
The following chart is a split between O/N (left) and RTH (right)
Click image for original size
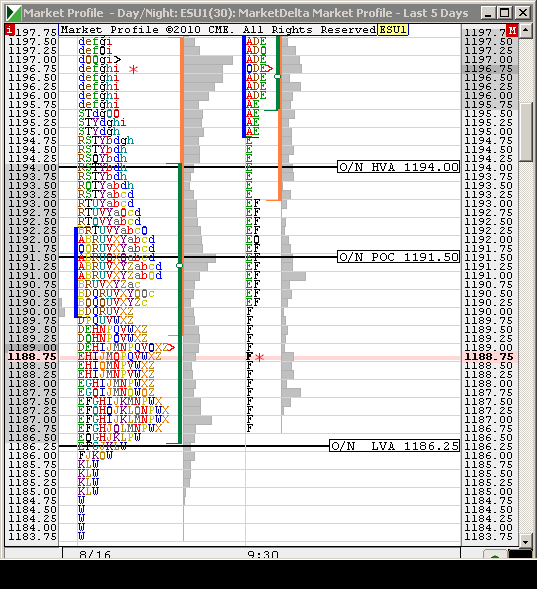
under 85.00 i see singles there is that rite
looking for a 92.50 retest....this 30 minute bar would create the second set of single prints IF it closes below the low of the 12 noon ending bar....
86.25 is VA low from YD day session..... $ticks in a down channel so a higher risk fade down here
86.25 is VA low from YD day session..... $ticks in a down channel so a higher risk fade down here
oh how they love to fill in low volume !!!
I have one more LV node at 1193.50
the 3 key low volume areas are 92.50, 97.50 and 1201.50.......I agree Lisa...$tick channel is trying to bust out which implies higher trade...I'd like to see the failed push towards the lows without getting new lows.......so basically a higher low down here....it would be nice if they can resolve yesterdays 1190 POC and have that hold back the decline
Wow! Thank you Bruce for taking the time to answer my question with so much detail. I really appreciate it.
Emini Day Trading /
Daily Notes /
Forecast /
Economic Events /
Search /
Terms and Conditions /
Disclaimer /
Books /
Online Books /
Site Map /
Contact /
Privacy Policy /
Links /
About /
Day Trading Forum /
Investment Calculators /
Pivot Point Calculator /
Market Profile Generator /
Fibonacci Calculator /
Mailing List /
Advertise Here /
Articles /
Financial Terms /
Brokers /
Software /
Holidays /
Stock Split Calendar /
Mortgage Calculator /
Donate
Copyright © 2004-2023, MyPivots. All rights reserved.
Copyright © 2004-2023, MyPivots. All rights reserved.