ES Friday 10-14-2011
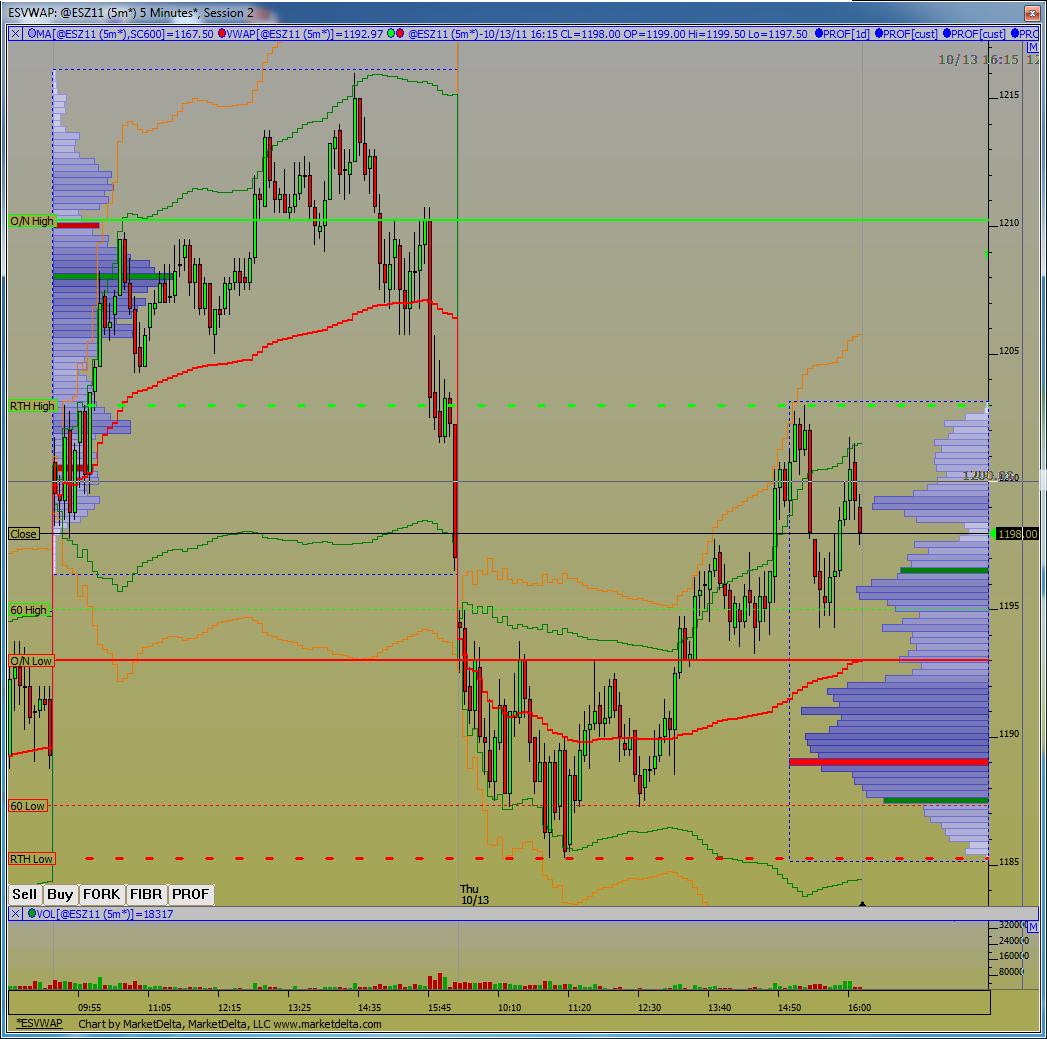
Big Low Volume support at 1198.
Current O/N high traded to the LVN from Wed. of 1210.50. Above that is 1214-1216.
Current O/N high traded to the LVN from Wed. of 1210.50. Above that is 1214-1216.
Click image for original size
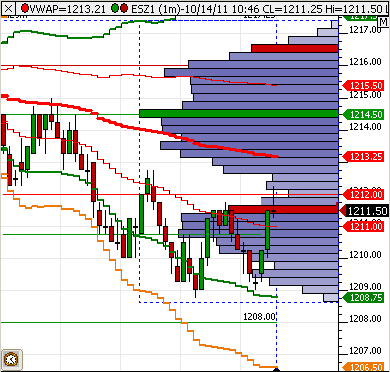
Bruce, I guess the best scenario would be : up to today's LV node and down to fill the gap. what do you think?
There is a fib. cluster between 1195 and 1198 That's why below 1195.
Now trading 1209.50 @ 10:32 E.T.
Now trading 1209.50 @ 10:32 E.T.
Originally posted by sandoxe
Anything below 1205 is most likely to move towards the daily support trend line at 1195.00
ES now trading 1211.00 @ 10:26 E.T.
out side t the first hour
us buyers want to see price stay above the peak volume from Wednesday and the 1210 low volume ..see liasa chart....
still low volume at 12.25 !!
Sorry I mean 1208 and 1205 Fib. support cluster.
Originally posted by sandoxe
There is a fib. cluster between 1195 and 1198 That's why below 1195.
Now trading 1209.50 @ 10:32 E.T.
Originally posted by sandoxe
Anything below 1205 is most likely to move towards the daily support trend line at 1195.00
ES now trading 1211.00 @ 10:26 E.T.
That's too much thinking for me Lisa...sellers obviously need this 08 - 1210 area fail first...hope not...that would at least put thems under that peak volume of Wednesday....
Then they need to see the 04 - 05 buyers attempt a push up....then they need to fail and then roll over for gap fill..
I think of each section of the bell curve and what is todays market trying to do with that bell curve from Wednesday...more later
Then they need to see the 04 - 05 buyers attempt a push up....then they need to fail and then roll over for gap fill..
I think of each section of the bell curve and what is todays market trying to do with that bell curve from Wednesday...more later
Originally posted by Lisa P
Bruce, I guess the best scenario would be : up to today's LV node and down to fill the gap. what do you think?
My VPOC (Wednesday) is at 1208
Hi Lisa, what software package produces your chart above
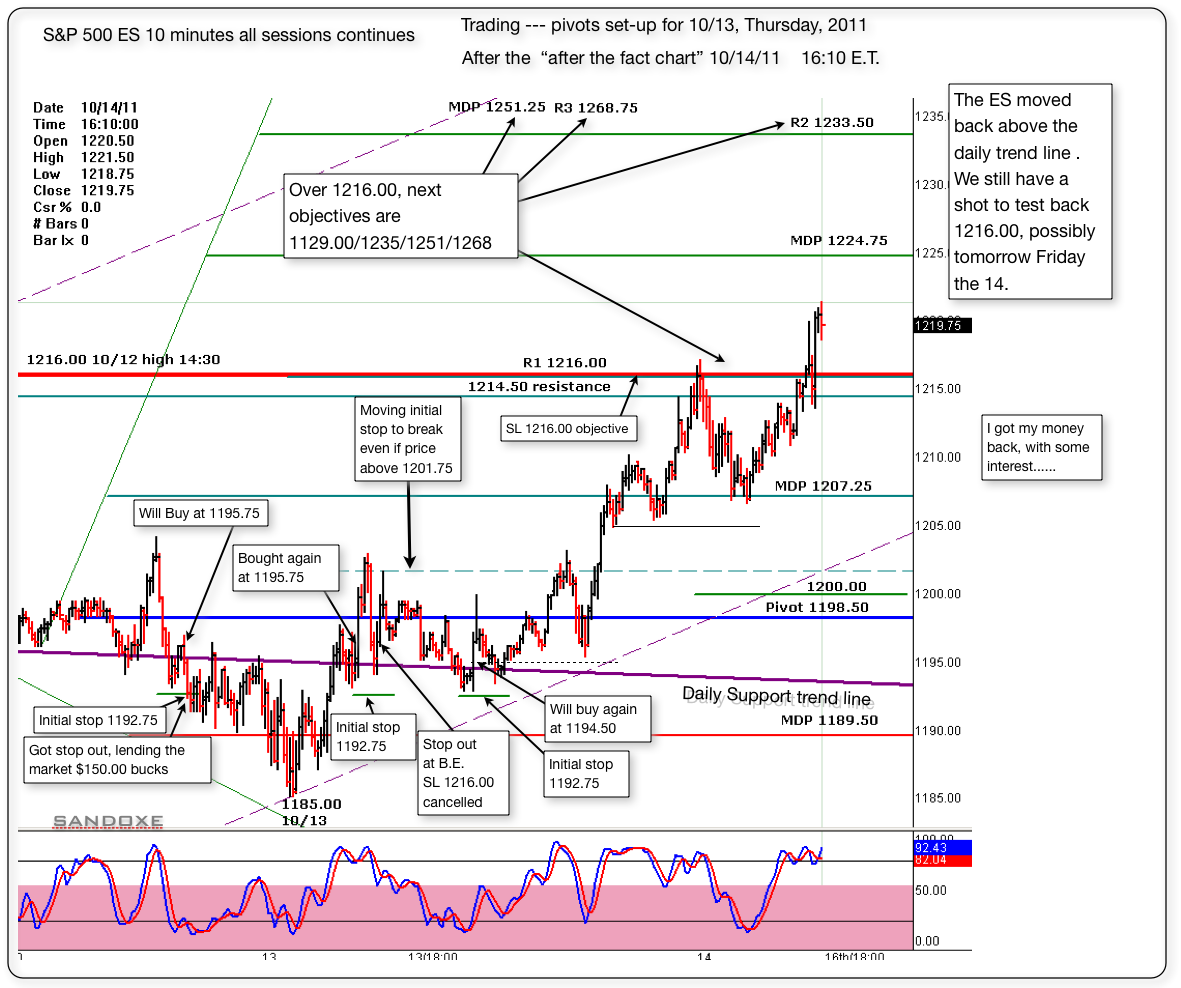
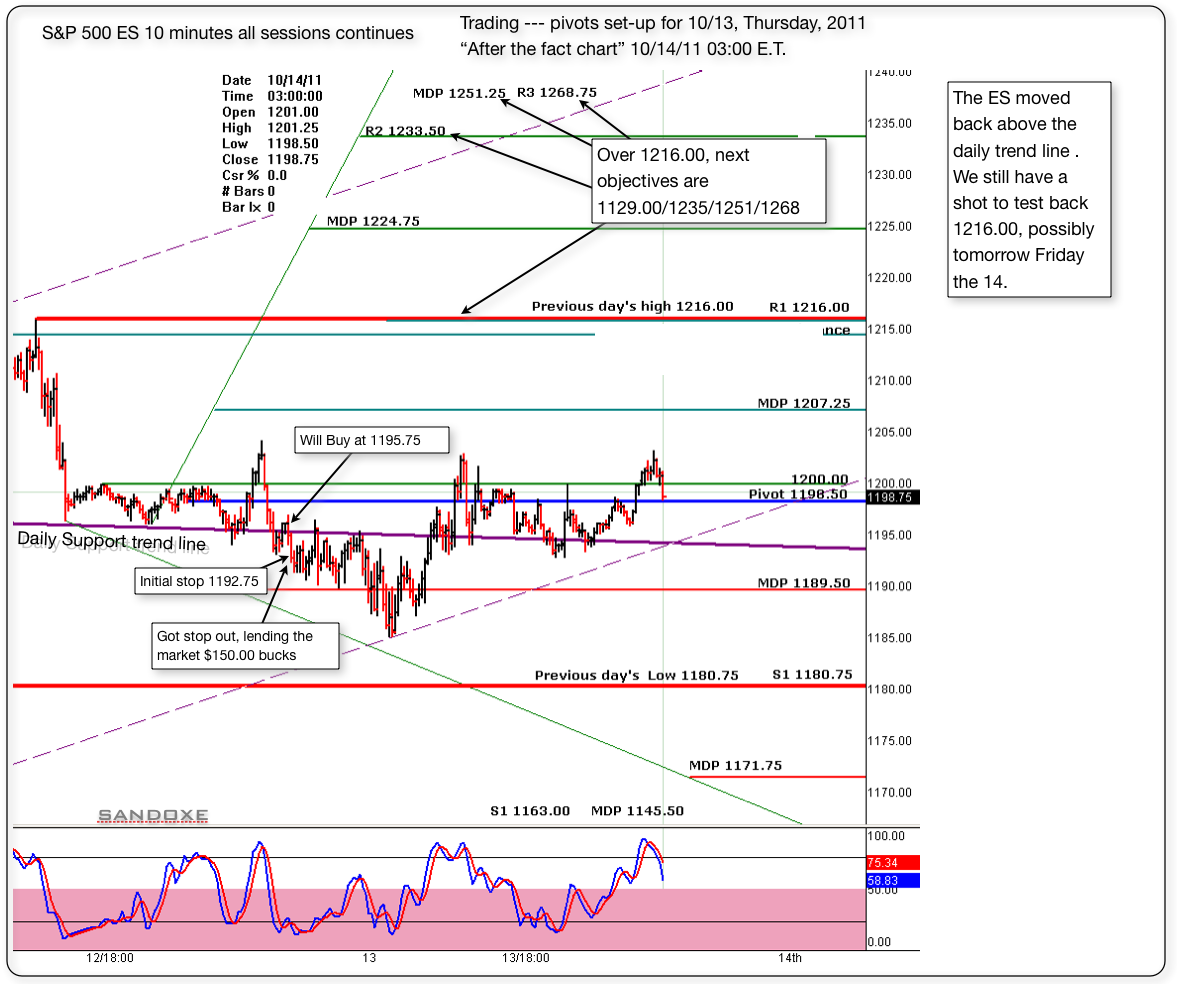
Below are some copied, pasted comments from yesterday's posts, and below that, today's chart with the same pivots from yesterday. In that chart you will see that, some of yesterday's pivotal levels worked well today too. This chart was also posted this morning at 03:00 (copy below) in Thursday's thread indicating we got another shot at 1216.00, today Friday the 14.
Some times you got to keep trying and trying, and if it's mean to be, it will be....
_________________________
sandoxe | 13-Oct-2011 at 5:18 AM
If the bulls still want to give it one more test to 1216, and possibly 1229 with good spike after that I'm Ok with it. Maybe today and tomorrow.
Below is the "before the fact chart" with the pivots set up for today. I'm buying at 1195.75, just above the daily trend line.
Initial stop at 1192.75.
__________________________
sandoxe | 13-Oct-2011 at 5:48 AM | Rep: 245 | Posts: 200 | mail
That was fast. I 'm lending the market $150.00 bucks. This is getting a bit bearish now that it has moved down below the support trend line. I gonna have to have my bear hat near by.
__________________________
sandoxe | 13-Oct-2011 at 3:02 PM
I gave it an other shot above the support trend line same price 1195.75 I'm at B.E. and will seat here till it gives me 1216 LOL
__________________________
sandoxe | 13-Oct-2011 at 3:43 PMl
What did you guys do? The market was doing well. now my stop got hit at B.E. -- Had and awesome day yesterday, and today I suck!
The market still owes me $ 150.00 bucks from this morning. hmmmm I need to see my self doing better, much better.........
Here's the chart posted this morning at 03:00. I was a bit tire and did not put all the stuff in it and did not made a new one with the pivots for today. Just use the same. At the long run is the same thing all over again, as you saw in the above chart. The pivots worked just as good.
I see for you the same I see for my self: Having an awesome, incredible, fun, weekend, best ever!!!
Some times you got to keep trying and trying, and if it's mean to be, it will be....
_________________________
sandoxe | 13-Oct-2011 at 5:18 AM
If the bulls still want to give it one more test to 1216, and possibly 1229 with good spike after that I'm Ok with it. Maybe today and tomorrow.
Below is the "before the fact chart" with the pivots set up for today. I'm buying at 1195.75, just above the daily trend line.
Initial stop at 1192.75.
__________________________
sandoxe | 13-Oct-2011 at 5:48 AM | Rep: 245 | Posts: 200 | mail
That was fast. I 'm lending the market $150.00 bucks. This is getting a bit bearish now that it has moved down below the support trend line. I gonna have to have my bear hat near by.
__________________________
sandoxe | 13-Oct-2011 at 3:02 PM
I gave it an other shot above the support trend line same price 1195.75 I'm at B.E. and will seat here till it gives me 1216 LOL
__________________________
sandoxe | 13-Oct-2011 at 3:43 PMl
What did you guys do? The market was doing well. now my stop got hit at B.E. -- Had and awesome day yesterday, and today I suck!
The market still owes me $ 150.00 bucks from this morning. hmmmm I need to see my self doing better, much better.........
Click image for original size
Here's the chart posted this morning at 03:00. I was a bit tire and did not put all the stuff in it and did not made a new one with the pivots for today. Just use the same. At the long run is the same thing all over again, as you saw in the above chart. The pivots worked just as good.
Click image for original size
I see for you the same I see for my self: Having an awesome, incredible, fun, weekend, best ever!!!
Emini Day Trading /
Daily Notes /
Forecast /
Economic Events /
Search /
Terms and Conditions /
Disclaimer /
Books /
Online Books /
Site Map /
Contact /
Privacy Policy /
Links /
About /
Day Trading Forum /
Investment Calculators /
Pivot Point Calculator /
Market Profile Generator /
Fibonacci Calculator /
Mailing List /
Advertise Here /
Articles /
Financial Terms /
Brokers /
Software /
Holidays /
Stock Split Calendar /
Mortgage Calculator /
Donate
Copyright © 2004-2023, MyPivots. All rights reserved.
Copyright © 2004-2023, MyPivots. All rights reserved.