ES Wednesday 2-22-2012
Click image for original size
tough tough market.
re the pivots.
a couple of years ago I wrote an indicator that plotted lines for Monthly pivots, then I eyeballed charts of daily bars (RTH Only).
Monthly R2 is usually a head banger. (not ALL the time, but more often than not, like any potential resistance level, I view potential resistance as NOT REALLY RESISTANCE if the bar that pierces it has big distance between O and C and C very close to H.
The reason I mention it is because both yesterday and today I had been hoping for an RTH test of monthly R2 (to short if I saw an acceptable ABC in the 5min)
Monthly R2 = 1369.25. so I would also be looking at the PA in 30minute and 15minute bars.
right now, today, seems like buyers are reluctant and price might have to probe lower to unlock some volume.
I'm done for the day, moving on to research. good luck to all
I know price printed 69.50 on SUnday, but when I viewed charts with monthly pivots it was RTH only prices.
Long here at the weekly pivot and low volume zone...this area down into 51.50 is critical to me...air pocket above into 55.50
this low volatility requires us to almost become position traders...for me the next area on the downside if this long fails is the low volume at 47 where I would try longs again.....the challenge with this low volume is it is easier for someone to push the market around to run stops.......
great posts today!!
great posts today!!
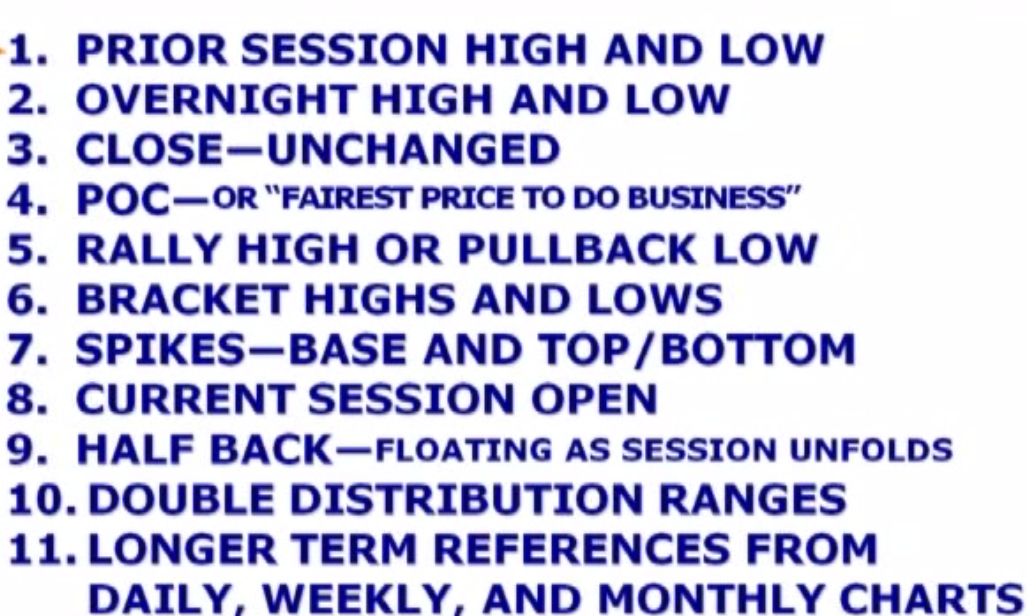
I've posted this before and these are the essentials....sometimes neglected by myself when throwing all this fancy bell curve/ mp stuff into the mix but always a great starting point to base things off of...
Click image for original size
Bruce, will you go short again if the ES fails to fill the air than it go down? if yes what price?
no I will not but it certainly is a good idea as we have this big bell curve that sits above now...especially if we combine the last two days...
I usually prefer to trade from areas created from prior days trading...not as much from DEVELOPING areas unfolding...but that's just me...so 53.50 and 51.50 are my nearest buy points from prior days..see yesterdays videos for reference
I usually prefer to trade from areas created from prior days trading...not as much from DEVELOPING areas unfolding...but that's just me...so 53.50 and 51.50 are my nearest buy points from prior days..see yesterdays videos for reference
Khamore....I am always looking to trade for breakout and breakdown points to be retested...those areas that create the "air" are such points from TODAY's trade...I lose when we have legitimate breaks
flat on runners at 57.50....this is where I would look to short as we are close to 50% of the bigger bell curve
58.25 is the exact 50% mark of that bell curve
Nice numbers here today...can u quote the source for these even if it is a paid service ? I think if you follow multiple markets then it is important to find a service with good numbers .
When following only one market then I'd suggest really digging deeper and generate your own numbers.
When following only one market then I'd suggest really digging deeper and generate your own numbers.
Originally posted by khamore1
Click image for original size
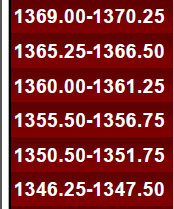
And to add to this S/R going forward, I've posted 2 charts for tomorrow here:
http://www.mypivots.com/board/topic/7277/1/es-thursday-2-23-1012
The first shows the PASR Zones/levels ... the second shows how those levels were derived. Like I've said, it's pretty simple.
http://www.mypivots.com/board/topic/7277/1/es-thursday-2-23-1012
The first shows the PASR Zones/levels ... the second shows how those levels were derived. Like I've said, it's pretty simple.
Emini Day Trading /
Daily Notes /
Forecast /
Economic Events /
Search /
Terms and Conditions /
Disclaimer /
Books /
Online Books /
Site Map /
Contact /
Privacy Policy /
Links /
About /
Day Trading Forum /
Investment Calculators /
Pivot Point Calculator /
Market Profile Generator /
Fibonacci Calculator /
Mailing List /
Advertise Here /
Articles /
Financial Terms /
Brokers /
Software /
Holidays /
Stock Split Calendar /
Mortgage Calculator /
Donate
Copyright © 2004-2023, MyPivots. All rights reserved.
Copyright © 2004-2023, MyPivots. All rights reserved.