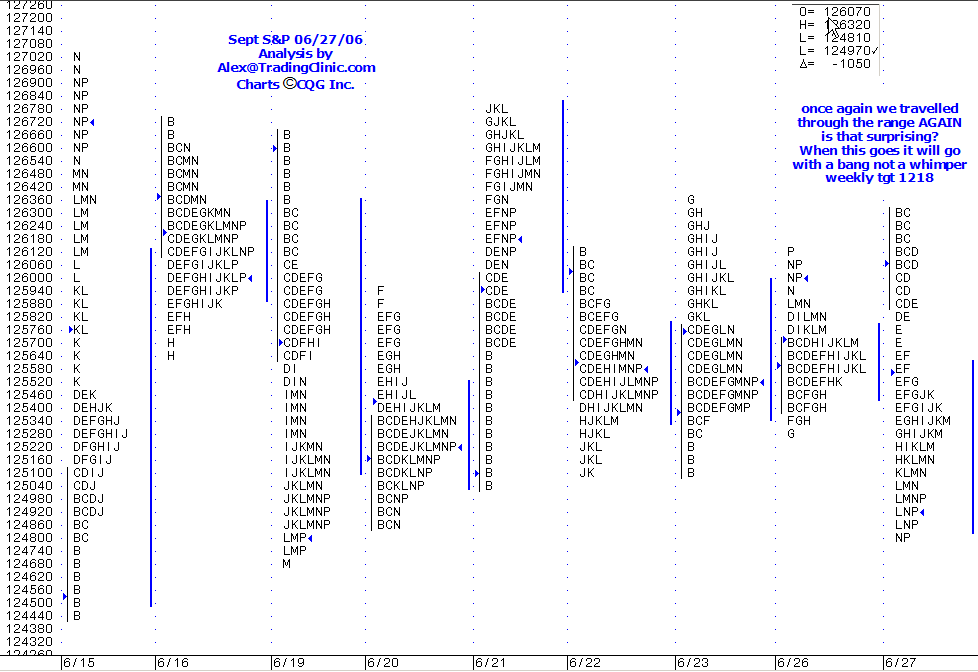
MP S&P Jun 27
Click image for original size
I enjoy your charts and most of your comments AlleyB but one thing that always seems to be lacking is the entry method and the stop loss. You post levels and your online presentations make comment about " large traders not using 5 minute charts and need time to get into positions" but yet you really never explain what these entries are.
A few weeks ago you made some comments about "if the entry was good you wouldn't have to worry about the stop being hit etc..." ( Going by memory so stay with me.......but are you saying that you are still short looking for the 1218 and holding positions against 25 point moves or more? How does the big trader handle this situation.......they are short hypothetically from 1250 with a target of lets say 1200......where is their stop when pirces are trading at 1210....? I find it hard to beleive that one would give up 40 points..( 1250 minus 1210) to gain the extra 10 points...wouldn't nake financial sense.....anyway I'd be more interested in the entires themselves from your levels and more importantly the risk management.....Can you give us some real examples and not just some levels...?
Thanks
Bruce
Bruce once a position starts to work then on approach to tgt yes a trail would be implimented. Normal risk management takes on varying degrees of style which might simply be a push through a significant support/resistance level or a TPO rotation. The point is sometimes it takes many small in and out goes before a position works in a campaign. To learn more about campaign style trading then I suggest you acquaint yourself with Jesse Livermore and the reminiscenes of a stock market operator
As to the commercial then their pockets are far deeper than you can imagine and they also have open to them all manor of hedging possibilities from options to swaps to the basket. I place more direct recomendations on the bond charts than stocks charts but there is significance to the pink dotted lines that I draw together with the commentary. I find most people that ask me the very same question that you have are 1. undercapitalised 2. too short term oriented 3. require a static rule based system 4. not properly cognisant of how long you have in a horizontal market to enter a position 5.are inflexible in style and understanding that a different response is required as the day unfolds. 6.have varying degrees of patience that frequently border on not allowing a trade to unfold with sufficient time or in reality have no patience at all
I post charts here in advance and leave my comments right or wrong to stand the test of time. I do not revert to a situation of could have should have etc. I just reviewed several of the charts and there are clear cut reference levels and many clear cut buy/sell levels with tgts. At times I am a little subtle in nature for it is up to you to find the breakthrough whereby you start to see similar patterns, events that allow you to pull the trading finger automatically just as in the way you drive a car. For as in driving there are many twists and turns stops and starts before you eventually hit the open road. I urge you to go back through the charts - print them out - create a record - study them.
In other words as a passenger in your car I can make suggestions as to navigation but it is up to you the driver to understand the weather, road conditions and drive at a suitable pace re the capabilites of the machine and man. The profile is a constant question until you find the right trade location. Trade location means finding that you are in a position that is profitable and cannot be touched by a short term squeeze. ie the classic 2 point rotation in ES which if 2 points is your stop is guaranteed to hit you 90% of the time. Pete said "You can’t respond mechanically and expect to succeed on a regular basis."
In other words, while you might be able to beat the standard probabilities in the short run, but the odds in favor of that happening in the long run are infinitesimal. There is a reasonable chance, for example, that a nickel tossed in the air five times might land heads up five times in a row. However, as you increase the sample size and toss the same coin 1,000 times, the probability is that the nickel will land heads up closer to 50% of the time, not 100% as it did in the smaller sample.
By developing a logical approach, it is possible to identify data parameters that work 60 times out of 100 – sometimes 90 times out of 100. The key to using these parameters effectively is thinking about the conditions in which they will succeed. You can separate the winning situations from the losers more often than not when you don’t react automatically. By way of explanation, the characteristics that classify daily market activity – Normal, Trend and Non-Trend – are defined data parameters. Once you recognize the characteristics of a Trend Day, for instance, the appropriate response is to go with the market. This strategy won’t work on normal days because normal day’s activity creates a different kind of opportunity which requires a different approach or response.
Consistent performance depends on LOGICAL DEDUCTION –
About WHAT is ACTUALLY happening in front of you on the screen. That’s why the only effective tools in today’s uncertain investment climate, in my opinion, are those that DON’T treat all process and opportunities as equal or alike. To evaluate the situation developing in front of you on the screen realistically, you need experience gained in the marketplace and tools that DON’T rely on happenstance."
No offense Alley B but I've been trading the S&P emini since 1998 and have had some very good and bad times in the market and with educators.....unfortunately your response is very typical of an educator who "dances" around the question..which was about specific entries and exits..these educators always want to make it sound as if "the answer lies within" or some other deep esoterical stuff..They basically try to answer a question with more questions...You don't want to do that...do you?....Livermore went broke and blew his brains out....not a man I want to emulate..Do you? ok so lets not get off track and lets get some real answers as to how even a big trader would trade from your levels....lets not worry about me and my capitalization ( or my spelling...lol)...No rhetoric or speeches...lets keep it simple....so you were targeting 1218 this week...no big deal that we are up at 1282..and it's cool that you where wrong I just want to know how the big traders handle failed analysis or when they consider themselves wrong. lets let the rubber meet the road and see how a longer term trader would actual do it with the profile ..post an entry, target and a stop loss.... or do they just scale trade..? Sorry if I sound pissed but everyone is posting levels and selling stuff...is anybody really trading anymore. I can tell you I'm legging into puts to target those gaps in the S&P charts but without an entry and a stop loss it's kind of useless.....
Bruce based off the given chart from wed for thursd
1.sell 1264.5 tgt 1218 stop and reverse 1271 stop 1265 tgt 1285
2.sell 1285 and sell short stop 1292.5
3.if tgt not hit then stop and reverse 1276 stop close 1285
4.sell break of 1268 & 1264
5.buy 1259 & 1256
6.sell break of 1254.5 tgt 1218
7.buy a close > 1285 tgt 1296
8.sell 1297.5 stop close 1301 and sell break of 1285 tgt 1269
9.buy a close > 1301 tgt 1309
10.buy 1311 tgt 1319
the CTi2 is constantly trading around a position both from the long tack and the short side trying to improve the overall risk. There are moments where they are clearly positioned. Right this moment they are long and were long coming into the FED. On Tuesday they were liquidiating long positions on Wednesday they bought it back on the close
There is a constant question of what is the market doing, what is it trying to do (a subtle difference), where is it in relation to open, close, poc, value. we are filling out the value as evidenced from the long term chart that I created on Jun 9th
Yes on Wednesday I was looking for 1218. I am still looking for 1218 but the timescale has been put back whilst we deal with other numbers first
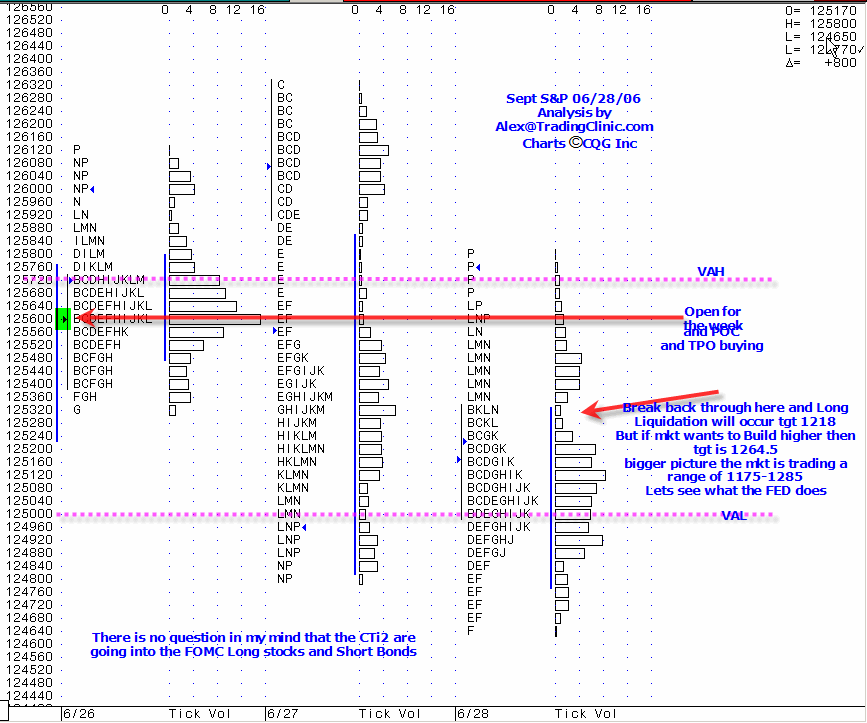
Click image for original size
1.sell 1264.5 tgt 1218 stop and reverse 1271 stop 1265 tgt 1285
2.sell 1285 and sell short stop 1292.5
3.if tgt not hit then stop and reverse 1276 stop close 1285
4.sell break of 1268 & 1264
5.buy 1259 & 1256
6.sell break of 1254.5 tgt 1218
7.buy a close > 1285 tgt 1296
8.sell 1297.5 stop close 1301 and sell break of 1285 tgt 1269
9.buy a close > 1301 tgt 1309
10.buy 1311 tgt 1319
the CTi2 is constantly trading around a position both from the long tack and the short side trying to improve the overall risk. There are moments where they are clearly positioned. Right this moment they are long and were long coming into the FED. On Tuesday they were liquidiating long positions on Wednesday they bought it back on the close
There is a constant question of what is the market doing, what is it trying to do (a subtle difference), where is it in relation to open, close, poc, value. we are filling out the value as evidenced from the long term chart that I created on Jun 9th
Yes on Wednesday I was looking for 1218. I am still looking for 1218 but the timescale has been put back whilst we deal with other numbers first
Click image for original size
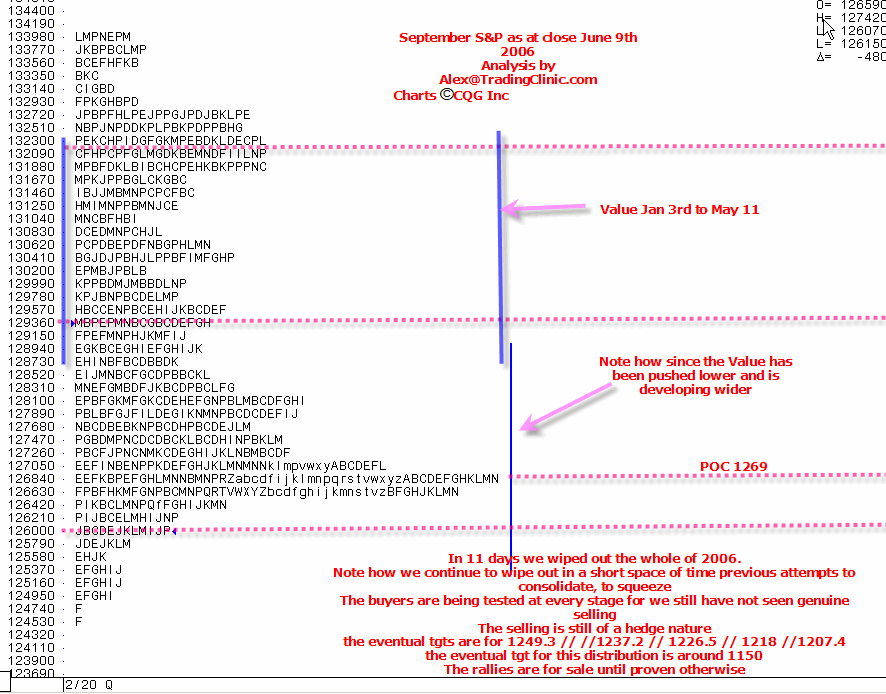
you will note how on the chart posted for Jun 9th which was a long term analysis and which I have not updated because I don't yet see a reason to update it but the base of VA as depicted by the blue lines held the market last week at 1287.25. Bruce you asked about long term style trading and the entry / exits and I responded with them. Those levels more or less (because they may get adjusted by a tic or two depending on unfolding VA) are for other time frame trading which perhaps I did not make absolutely clear as I referenced above them everything by saying from the wed chart for thursday. In other words the 10 entry / tgt / exit levels I gave are valid for forthcoming days and possibly weeks
Bruce: I still see no reason to update the charts for we are following the plan quite nicely and we are a) filling out the lower value on the longer term chart and b) going to the levels perfectly on the shorter term charts. the highest short which was originally at 1285 and could easily have been adjusted to be a couple of points higher now cannot be touched. ie they cannot be turned into a loss for the trade location is now clear.
we are now at point no 6. and the stop would be 1272
herewith July 13th. Uncanny how the tgts line up with the previously posted Long term chart dated Jun 9th .
Click image for original size
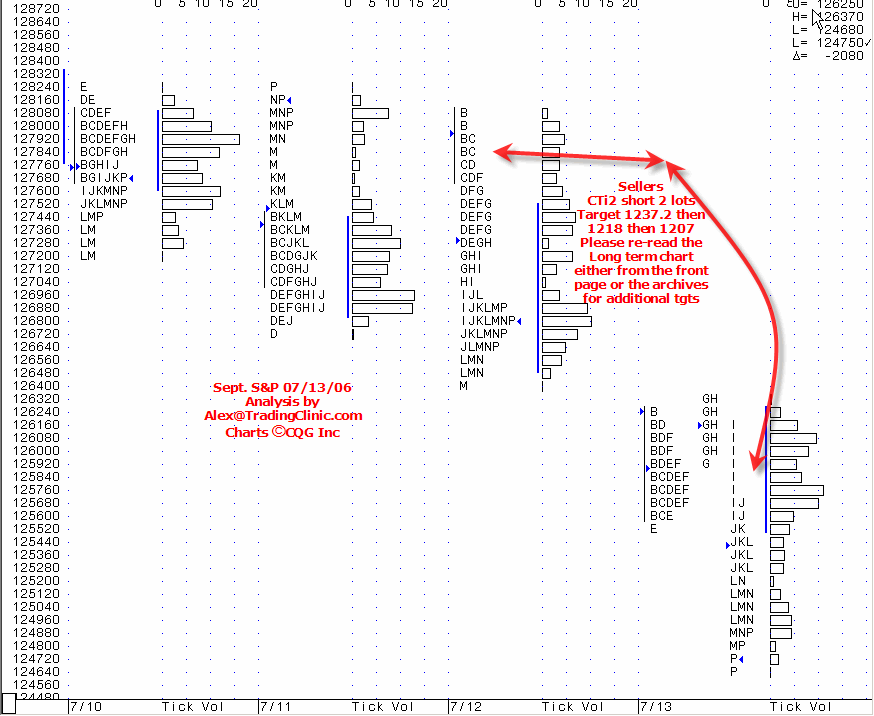
So Bruce. here we are on July 15th and two weeks post your request for further elaboration about exact calls and my posting on June 30th the scenario (scroll up to June 30th to see) It is plain for all to see that number 2 number 4 and number 6 short at 1285 short on break of 1268 and short on break of 1254.5 are all in play for target 1218
the stop is lowered from 1272 to 1269. Remember trading is also about a degree of flexibility for example take note of 1237.2/1237.3 both of which on charts posted within my own website have been highlighted for several days previously.
But you asked for further more detailed exact calls than you understood from my daily charts posted and now 2 weeks later the campaign as laid out back on June 30th starts to come to fruition. I gave these "calls" in advance based off analysis from the profile and result in 3 lots short at average 1269 . Then for comparison sake remembering that this campaign was laid out before the fact back on June 30th it makes for interesting reading to see after the fact how the CTi2 operated:
They shorted as follows 1280 from 7/12 then 1275 same day then 1263 on 7/13 then 1248 on 7/14 and they took back at 1237 on 7/14. that gives an average after at least 1 lot covered with 11 points a net short 3 at 1266.5.
Thanks for all the work you put into these Alley B...I just got back
so I haven't had time to comment on them as you went along...I will review
them tonight,,,I 'll aslo print them out for future study
so I haven't had time to comment on them as you went along...I will review
them tonight,,,I 'll aslo print them out for future study
The eliminating of granular tick inforamtion from the data only effects (from what I can work out) people who use tick information to increment an "information package" in their analysis, strategies and signals.
This should have zero effect on people who use time or volume based charts and also zero effect on CTI data and anything else - except of course it will speed up processing because of lower bandwidth.
Having said that, however, I can see where this could be detrimental if a large volume accumulates at one price without it being reported, which would be a rare case.
Emini Day Trading /
Daily Notes /
Forecast /
Economic Events /
Search /
Terms and Conditions /
Disclaimer /
Books /
Online Books /
Site Map /
Contact /
Privacy Policy /
Links /
About /
Day Trading Forum /
Investment Calculators /
Pivot Point Calculator /
Market Profile Generator /
Fibonacci Calculator /
Mailing List /
Advertise Here /
Articles /
Financial Terms /
Brokers /
Software /
Holidays /
Stock Split Calendar /
Mortgage Calculator /
Donate
Copyright © 2004-2023, MyPivots. All rights reserved.
Copyright © 2004-2023, MyPivots. All rights reserved.