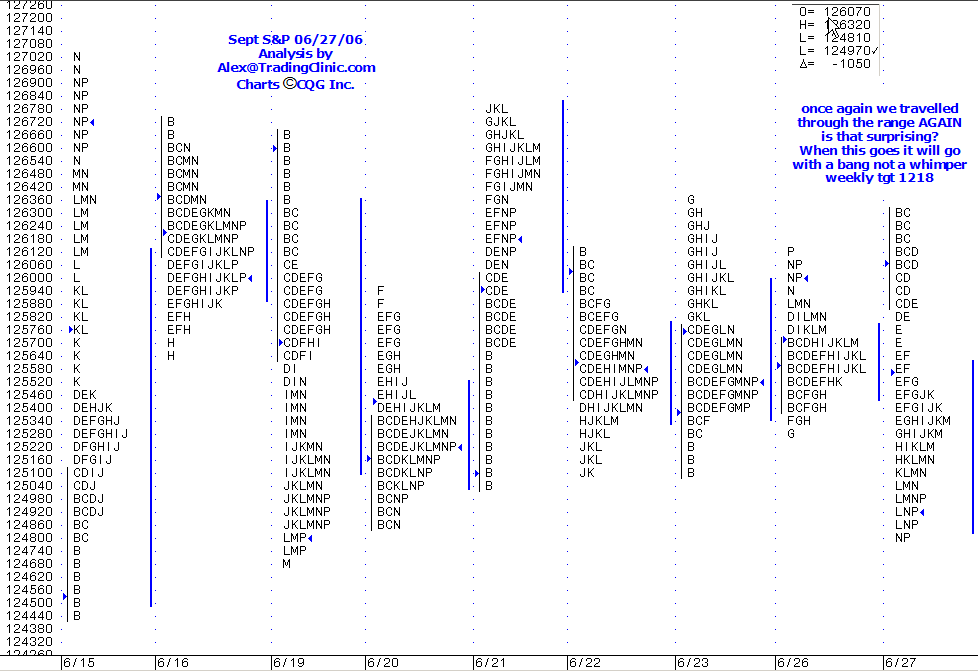
MP S&P Jun 27
OK thx Daytrader. So now the next question is what is the source of data that chart-ex uses to calculate and then redraw in their graphs.
I believe that they pull it directly from the CBOT on a daily basis.
The negative numbers for the cti means net short. Remember this isn't taken from open interest data it is taken from the daily volume data. The CBOT distributes raw data net short/long data for each cti group (http://cbotdataexchange.if5.com/Data_LDB_VAP.aspx ) We then put this data into our graphic.
The CME has this data but doesn't distribute it.
If you have any further questions, don't hesitate.
The CME has this data but doesn't distribute it.
If you have any further questions, don't hesitate.
all exchanges have the data . they are required to collate it by the CFTC. The CME used to supply the data then stopped distributing it then they made it only available to memebers then they stopped doing that then it was possible to see your counterpart via the clearing code on certain platforms now they have stopped doing that. I repeat the more we become electronic the more there is less transparency. it is only a matter of time if this errosion of information continues before they stop reporting Insiders trades at the NYSE
The CFTC is having a discussion paper on the Commitment of Traders reports.
pls scroll to the bottom and read Question 5. then scroll back to the top and follow the procedure for replying.
You have until August 21st to reply but please do not delay:
http://www.cftc.gov/foia/fedreg06/foi060621a.htm
and lastly Chartex you take the electronic data? , the Floor data? options, spreads ? how far do you break the data down to analyse it?at $15 a pop per chart that gets to be quite expensive.
quote:
Originally posted by alleyb
...stopped doing that then it was possible to see your counterpart via the clearing code on certain platforms...
I'm surprised that they didn't make the software strip out that sort of information instead of stopping it...
oh and of course the latest gimmick from the CME . it would be them wouldn't it.... is not to report the time and sales correctly any more preferring to lump together for example that if someone sells 10 lots it will be reported now as just 10 and not with the breakdown of say 5 and 3 and 1 and a 1. Their argument is that it saves bandwidth. My argument is thats rubbish it is part of the big commercials interests who of course now own these de-mutualised exchanges to obfusticate. Electronic trading actually allows all the old abuses to carry on but this time legally on the basis that there is transparency. Humbug I say
The eliminating of granular tick inforamtion from the data only effects (from what I can work out) people who use tick information to increment an "information package" in their analysis, strategies and signals.
This should have zero effect on people who use time or volume based charts and also zero effect on CTI data and anything else - except of course it will speed up processing because of lower bandwidth.
Having said that, however, I can see where this could be detrimental if a large volume accumulates at one price without it being reported, which would be a rare case.
Emini Day Trading /
Daily Notes /
Forecast /
Economic Events /
Search /
Terms and Conditions /
Disclaimer /
Books /
Online Books /
Site Map /
Contact /
Privacy Policy /
Links /
About /
Day Trading Forum /
Investment Calculators /
Pivot Point Calculator /
Market Profile Generator /
Fibonacci Calculator /
Mailing List /
Advertise Here /
Articles /
Financial Terms /
Brokers /
Software /
Holidays /
Stock Split Calendar /
Mortgage Calculator /
Donate
Copyright © 2004-2023, MyPivots. All rights reserved.
Copyright © 2004-2023, MyPivots. All rights reserved.
