MP S&P Jun 27
Click image for original size
Hi AlleyB,
Great stuff , thanks so much for coming through with these
"market calls" and great ones too. I'm curious at what logical points the
big players would have their stops at? Last you mentioned I beleive
the stop was at 1272 but I'm sure that was lowered. So if the market was at 1232..
like it was today ( Tuesday) and they/you had a target of 1218 where would you have tightened
to and more importantly why that particular area ( assuming it is based on a MP price
point). I assume with only 14 points away from target ( 1232 - 1218 = 14) that the stops should be
adjusted. Thanks again. I personally wouldn't risk 14 points to make an additional 14 but
perhaps the "big players" do it different. Thanks
Bruce
Bruce the CTI2 last 2 days took back 2 additional shorts leaving themselves short one coming into today Wednesday and today they scrambled out of that last short. now flat. waiting to setup most likely on Monday
Bruce to add a little for I see I did not address all your points.the 1237 level was highlighted on a couple of recent days and the break below 1238 to 1231 with the snapback left buying tails so the reality was until we got a new low close then closing off most of the shorts was the sensible idea for on an onjective basis there was buying not selling . the mistake if mistake it was was coming into today wednesday short 1 lot rather than long. And you noticed the scamble with bernanke's remarks which changed the picture in terms of interest rate outlook from bear to neutral.They are flat the S&P having now neutralised the chart. and awaiting the emerging development likely to show their hands next week and likely to let the option market play with itself. 1269 is the point of control of recent distribution and was today's high against whioch clearly one commercial lent by selling the equivalent of 650 million bucks worth of futures and buying the equivalent in MRK. The CTi2 who did this clearly has a negative bias on the tail of this basis or program trade involved and it will be interesting to watch this unfold. On another plane CTi2 sold Nasdaq today to be 1 lot short initially at 1505 which then was finessed to 1509. it was closed after hours for 15 points and the next level they will operate is 1530 should we get there.
yeah..I was watching to see what those buying tails where going to do today. Where does the "average joe " see what the Cti2 folks etc are doing? Thanks for clarifying...
Great stuff....u may make a position trader out of me yet...
Bruce
Great stuff....u may make a position trader out of me yet...
Bruce
Bruce: re CTi2:
in CBOT product you have access albeit on a paid basis to the the CTi data. Allo exchanges are obliged to collate the data but only the CBOT publishes it. Therefore you that & you take the Commitment of Traders reports published on a Friday night after the close as at the prior Tuesday
**********(although there is a consultation document on this whereby there is a minor suggestion that the CFTC may stop publishing the data (Transparency...humbug..) - http://www.cftc.gov/foia/fedreg06/foi060621a.htm scroll right to the bottom and read point no 5. and if you feel inclined please follow the correct procedure for responding to this discussion document*****
& you take the open interest and volume figures as published by the exchanges however they are 24 hours late
Alternatively you read the profile.
In MP102 which is still available from either my website or from the education page in the CBOT http://www.cbot.com/cbot/pub/page/0,3181,1184,00.html (scroll down a bit inside their page for the link)I give a method (It is in fact one of two methods that I use to establish my own version of the Liquidity Data Bank and I use this in all products) to establish a count which establishes CTi2 position
www.chart-ex.com has free cti data for CBOT products. To view the data just hold the "Shift" key and click through CTI1-4. Once you select what CTI to view, just release the shift key and you can scroll to see cumulative CTI volume at price.
Shame that the CTi charts and and their relevant links posted by Chart-ex do not work.
Thanks for taking a look. The cti data is available, just not via the link. I am reconfiguring on how the CTI data will be displayed via the link. I want to let the user see all the CTI data at glance and not have to scroll for the data. I am sorry for the delay.
In the meantime, select a chart page,hold the shift key down and click to scroll through the cti data. The Bond cti2 and cti4 is very interesting!
I think once I have the new cti charts up you will find the information very useful in making a trading decision.
In the meantime, select a chart page,hold the shift key down and click to scroll through the cti data. The Bond cti2 and cti4 is very interesting!
I think once I have the new cti charts up you will find the information very useful in making a trading decision.
Sorry but still all I could see was volume at price not break down of CTi data
Alley, try this: Go to this link: http://www.chart-ex.com/charts/30_year_tbonds_daily.htm (e-30-YR T-BONDS Market Numbers) and then move the cursor to a price. I have selected 107-16 but the charts may have been updated by the time that you read this. Then hold down the shift key and left click the price and then you will see the CTI numbers change each time you left click so long as you're holding down the shift key. Let me know if this works for you.
Not sure why there are negative numbers on the chart. You can't have a negative CTI volume at any level can you?
Click image for original size
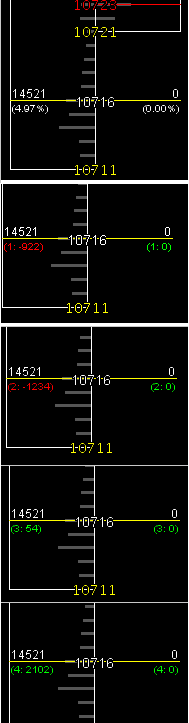
Not sure why there are negative numbers on the chart. You can't have a negative CTI volume at any level can you?
The eliminating of granular tick inforamtion from the data only effects (from what I can work out) people who use tick information to increment an "information package" in their analysis, strategies and signals.
This should have zero effect on people who use time or volume based charts and also zero effect on CTI data and anything else - except of course it will speed up processing because of lower bandwidth.
Having said that, however, I can see where this could be detrimental if a large volume accumulates at one price without it being reported, which would be a rare case.
Emini Day Trading /
Daily Notes /
Forecast /
Economic Events /
Search /
Terms and Conditions /
Disclaimer /
Books /
Online Books /
Site Map /
Contact /
Privacy Policy /
Links /
About /
Day Trading Forum /
Investment Calculators /
Pivot Point Calculator /
Market Profile Generator /
Fibonacci Calculator /
Mailing List /
Advertise Here /
Articles /
Financial Terms /
Brokers /
Software /
Holidays /
Stock Split Calendar /
Mortgage Calculator /
Donate
Copyright © 2004-2023, MyPivots. All rights reserved.
Copyright © 2004-2023, MyPivots. All rights reserved.