What is a Single Print?
A Single Print is a the first breakaway price at which the market only traded once during a bracket.
and so is this:
D

D

D

DE

DE

E        this is a single

E

E

EF

EF

EF

EF

EF

F
and so is this:
FIn both of these examples, the Single Prints will only be confirmed when the F bracket closes. Until it closes they can be referred to as unconfirmed singles.
EF
EF
EF
EF
EF
E
E
E this is a single
DE
DE
D
D
D
Three months of forward testing the Single Prints as a solitary strategy in trading the E-mini S&P500.
May June July
May June July
I was wondering if it is possible to test a strategy of trading back to go for the single print retest...in other words can you derive from your data how often single prints get filled in on the same day they are created, the day after or anytime thereafter...I usually expect single prints to get retested...at least part of the single print zone ( part of the single letters).I seems that the internet has made some of these concepts less effective and I like to go the opposite of what everyone else is doing.
So on single prints to the downside I will eventually take a long position provided I get a good entry signal...to get long and have the area tested.
Bruce
So on single prints to the downside I will eventually take a long position provided I get a good entry signal...to get long and have the area tested.
Bruce
I'm going to be working on some Internet based stats testing and will keep this in mind when I'm doing it. If I incorporate Single Prints into it then I will most probably add the ability to measure that.
One thing that you have to remember is that in the long term the Single Prints formed above us will always be filled in because in the long term the equity market always makes new record highs. The corollary is that it is highly likely that there will be Singles below us that are never filled in once formed.
Singles form an interesting pattern in that the ones closest to the current point of trade are the youngest and the ones the furthest are the oldest.
Day Trading....
As per my comments in a previous thread my software (your DVATOOl) alerted me that there was a single print above the market at 1432.77 which was left on Dec 21, 2006. The market traded below that level until 12/27/2006, and it gapped up and took this number out, but all subsequent pullbakcs on Dec 27th, 28th, and so far the 29th to this area have led to rallies........interestingly, this has been a pivotal area in the overnight market as well...........
Interesting........
CURRENTLY SHOWING A SINGLE BRACKET BELOW THE MARKET AT 1428? Is this correct? The software is attributing it to a date that the market did not trade through that price, but it looks like an area that might have left a single bracket back on 12/26..........
quote:
Originally posted by pem06081971
As per my comments in a previous thread my software (your DVATOOl) alerted me that there was a single print above the market at 1432.77 which was left on Dec 21, 2006. The market traded below that level until 12/27/2006, and it gapped up and took this number out, but all subsequent pullbacks on Dec 27th, 28th, and so far the 29th to this area have led to rallies........interestingly, this has been a pivotal area in the overnight market as well...........
Yes, PT and I had noticed that and were commenting on it in PT's journal
quote:
CURRENTLY SHOWING A SINGLE BRACKET BELOW THE MARKET AT 1428? Is this correct? The software is attributing it to a date that the market did not trade through that price, but it looks like an area that might have left a single bracket back on 12/26..........
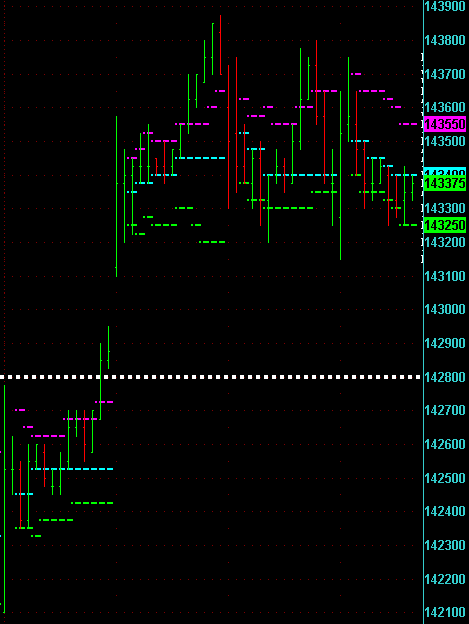
Correct, the Single Print was created on 12/26 and will remain on the chart until it is traded through. (The Single Print will also disappear off the chart if not enough data is loaded to calculate it. If, for example, you only load 30 days worth of data when you load your charts and a Single Print was created 35 days ago then it will not show up on the chart because it could not be calculated with the data loaded into the chart.)
Here is a chart of what you are looking at.
Click image for original size
Emini Day Trading /
Daily Notes /
Forecast /
Economic Events /
Search /
Terms and Conditions /
Disclaimer /
Books /
Online Books /
Site Map /
Contact /
Privacy Policy /
Links /
About /
Day Trading Forum /
Investment Calculators /
Pivot Point Calculator /
Market Profile Generator /
Fibonacci Calculator /
Mailing List /
Advertise Here /
Articles /
Financial Terms /
Brokers /
Software /
Holidays /
Stock Split Calendar /
Mortgage Calculator /
Donate
Copyright © 2004-2023, MyPivots. All rights reserved.
Copyright © 2004-2023, MyPivots. All rights reserved.