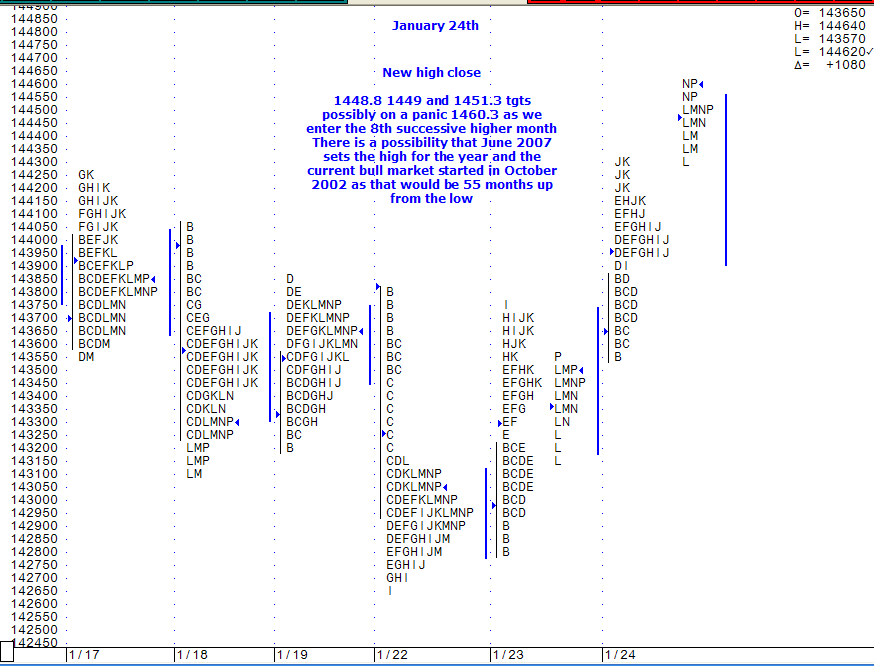
MP - S&P Jan 24th
55 months! I hadn't realized that it had been that long. Sounds a lot longer when you phrase it like that.
despite the bull comment I was making on the chart .The clue on Thursday was the fact that we could not sustain the new highs above 1445 and then the break of 1440 back into the previous days value had found that everyone was in fact long and the market needed to auction lower to shut off the selling, hence the lack of any meaningful bounce. and that the 55 month bull run suggests that at the least a consolidation 2 way risk trade to re-enter the arena if not a reversion to the mean
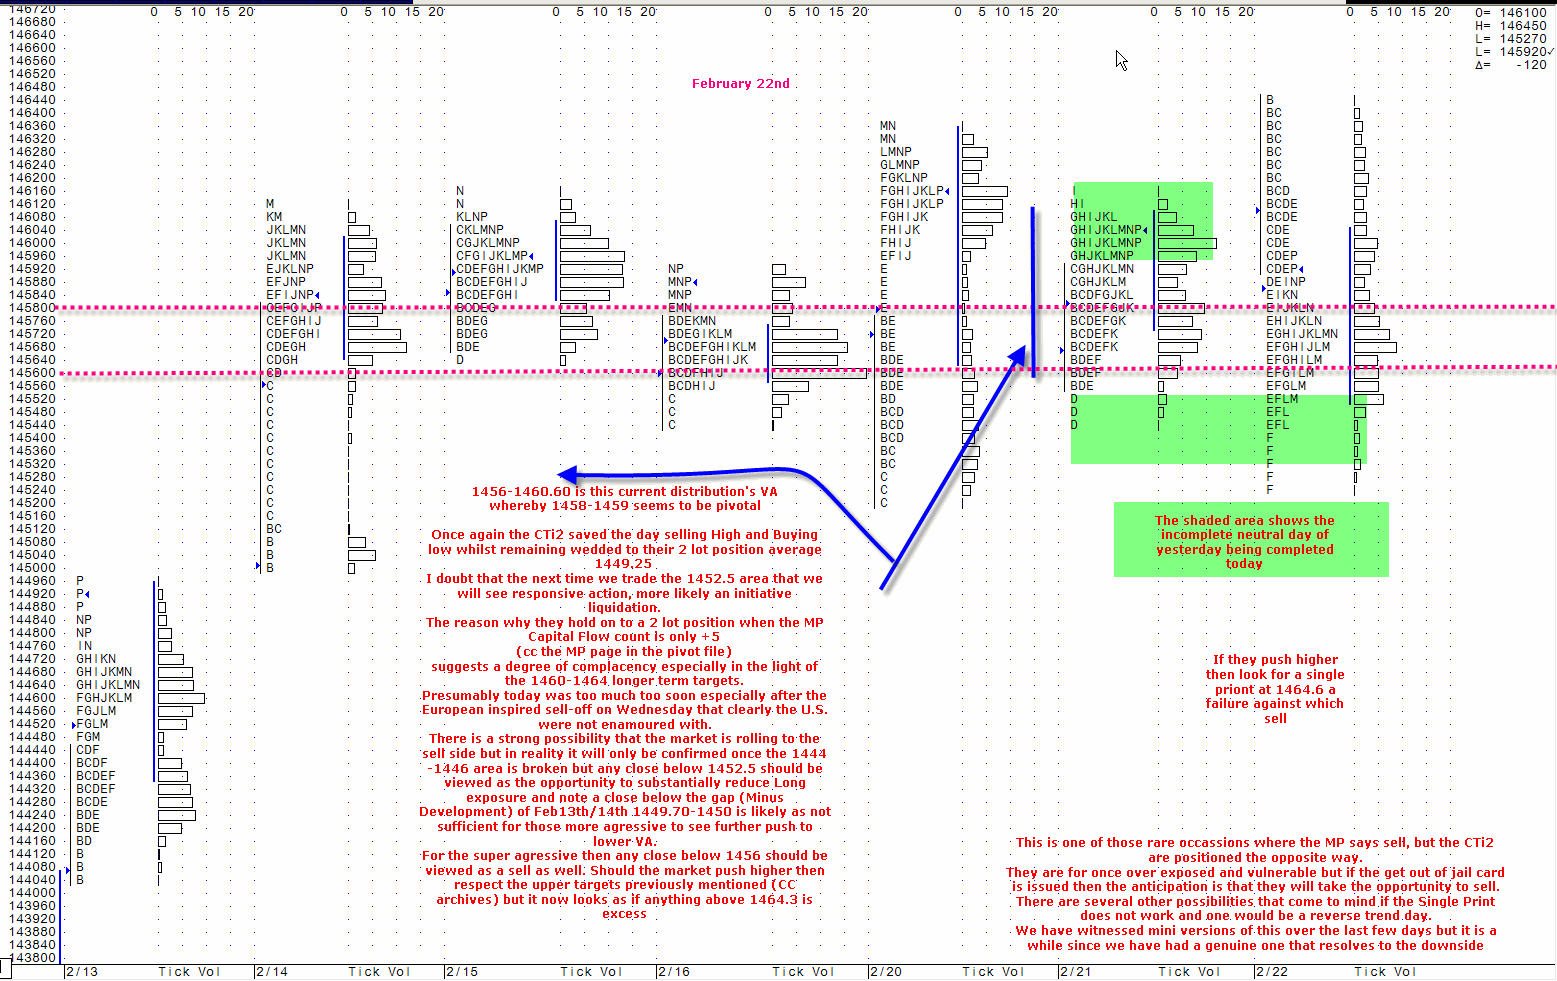
Thanks for all these Charts Alley B. They aren't wasted on me. I appreciate you taking the time to post them. Do you run Multi - day profiles? I know some use 5, 10 , 20 day profiles but to me it would be logical to use the dates that encompass the most recent trading or range...just curious how you handle it. I may have asked this before so I apologize if you covered this already. I'm watching 1452.50 as a key point as it seems we have spent a lot of time around there on the upside
Bruce
Bruce
I have been looking at alleyb's charts and enjoy reading them. He does use multiple day profiles. I think that he uses the concept that Steidlmayer talks about in his last book. That is he waits for the market to break out of a range and then starts a new profile from that bracket.
Thanks Elite...I struggle with longer term profiles....slowly picking it up..but too slow..I just never know where to begin and end them.
Bruce
Bruce
From what I understand of Steidlmayer's book you start when the market breaks from the congestion zone. The you keep on adding up brackets until it breaks again and then you start a new area.
So if we take the ES for example. The current profile that we are building right now started at 1:30pm on Friday. That is when the market broke out of its current range.
So I just took the highs and lows from then and I put them in the TPO generator and this is what I get:
144800 D
144775 D
144750 D
144725 D
144700 D
144675 D
144650 D
144625 D
144600 Dd
144575 Dd
144550 Dd
144525 Dd
144500 Dad
144475 Dabd
144450 Dabd
144425 DZabd
144400 DEZabcd
144375 DEIJZabcd
144350 DEIJZabcd
144325 DEIJZabcd
144300 DEHIJZabc
144275 DEGHIJZbc
144250 DEGHIJZbc
144225 DEGHIJZbc
144200 DEGHJZbc
144175 DEFGHJZb
144150 DEFGHJZ
144125 DEFGHJZ
144100 EFGJZ
144075 EFGJKLQZ
144050 EFGJKLMQZ
144025 EFGJKLMNQ
144000 EFGJKLMNPQR
143975 EFGJKLMNPQRS
143950 FGKLMNPQRS
143925 FGKLMNPQRS
143900 FGKLMNPRS
143875 FGKLMNPRS
143850 FKMNRS
143825 FKMNRSWY
143800 FMNRSWXY
143775 FNSWXY
143750 FNSTWXY
143725 FSTVWXY
143700 FSTVWXY
143675 STVWX
143650 STVWX
143625 STVW
143600 STV
143575 STV
143550 V
143525 V
143500 V
VAH= 144375
POC= 143975
VAL= 143725
(I edited it to show the VAH in blue.)
1446.25 is a major resistance point because it is a single print in market profile. This is just a fancy way of naming and quantifying a breakaway point. This breakaway point happened on the same half hour bracket that this long term profile was created. So you can see that the two go hand in hand almost. I do not know if this happens every time but it is something that probably needs more investigating. For example: you can start a new long term profile each time a single print is created.
Its funny how that 1452.5 and 1446.25 keep on cropping up.
Re multiple timeframes. I look for obvious points of ending / starting the simplest way of describing it would be a reversal of trend
Re multiple timeframes. I look for obvious points of ending / starting the simplest way of describing it would be a reversal of trend
Thanks for all this Elite trader..for some reason I didn't see these replies..I appreciate it. And you too Alley B..Anyway start reading Daltons New Book?
Bruce
Bruce
quote:
Originally posted by elite trader
From what I understand of Steidlmayer's book you start when the market breaks from the congestion zone. The you keep on adding up brackets until it breaks again and then you start a new area.
I doubt that it was me that invented it. I think that like a lot of traders you/I come up with an idea/indicator and after you've described it to another trader they say "yeah that's called a ________ " and then you discover that it's been in use for 50+ years
Emini Day Trading /
Daily Notes /
Forecast /
Economic Events /
Search /
Terms and Conditions /
Disclaimer /
Books /
Online Books /
Site Map /
Contact /
Privacy Policy /
Links /
About /
Day Trading Forum /
Investment Calculators /
Pivot Point Calculator /
Market Profile Generator /
Fibonacci Calculator /
Mailing List /
Advertise Here /
Articles /
Financial Terms /
Brokers /
Software /
Holidays /
Stock Split Calendar /
Mortgage Calculator /
Donate
Copyright © 2004-2023, MyPivots. All rights reserved.
Copyright © 2004-2023, MyPivots. All rights reserved.

