CHART-EX WEEK VS DAY CHART 181
Click image for original size
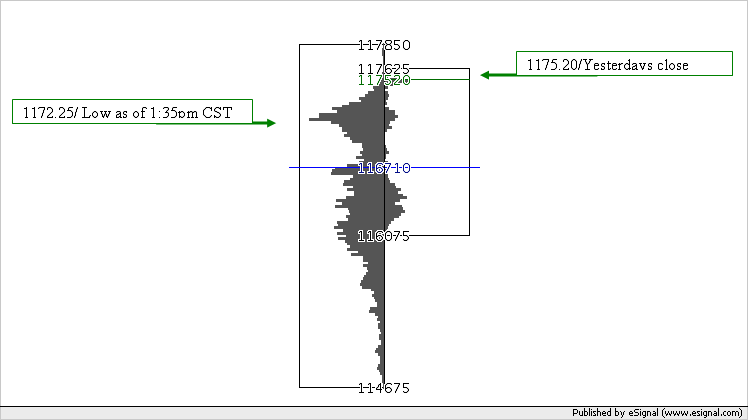
CHART-EX WEEK VS DAY CHART
MAY 10-16, 2005 VS. MAY 17, 2005
The above Chart-Ex chart displays the trading ranges and cumulative volume at price for the time frame;
Week = May 10-16, 2005
Day = May 17, 2005
- As of 1:35 pm CST, May 18, 2005, the delayed quote for the E-MINI S&P 500 05JUN is HIGH=1189.50, LOW= 1172.25, LAST=1185.50
- As you can see from the chart, the EMINI S&P 500 used the first high volume area below 1175.20 (yesterday’s close) for its support.
- The CHART-EX WEEK VS DAY java chart displays weekly high volume area at 1172.25 (today’s low as of 1:35 pm CST).
- As the market was approaching it’s daily low today, traders were able to use the weekly high volume accumulation as a support/buy signal area.
I've never seen this before but it looks very interesting. You can see how price around the 1170 area was virtually ignored as all the volume happened above and below that area.
I'm just looking now at this week's chart for the ES for Week vs Day and see that Friday vs the previous week is very one sided and right at the limits - which is logically what you would expect considering how the week trended. Also the most volume happened at 1187.00 price so I think that this is going to be a major area again for this week.
If I'm reading the chart correctly it says that 90,345 contracts traded at 1187.00 during the week which was 2% of the total week's volume?
I was just looking at that Week vs Day chart for the ES again and at that really high volume reading. The high for the week is 1193.00 and the low is 1146.75 which is 46.25 points range or 185 ticks of range. That means that if the volume was evenly randomly distributed then at each price there should be 0.5% of the volume. I don't know what this means or how to use it yet but it is interesting nevertheless.
Thank you for your kind words. Here is how I use the Chart-Ex volume at price chart. The chart displays cumulative volume at each price in a comparative format, which gives a visual strength/weakness to each price for time frames/trading ranges.
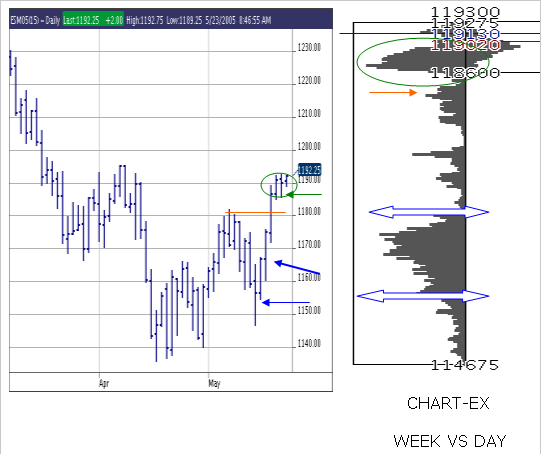
- The first chart is a daily standard bar chart. I see a strong upward move off its weekly low, and a flag formation, with a small mask.
- The high volume in the flag formation is pinpointed at 1186.50-1190.25(good volume came in on Friday at 1190.25, (I will use this) this becomes my first Support area.
- If this area is broken, I look at the weekly volume distribution. I like that the volume by the weekly low is low (rejection of price area).
- Next I want to see where the high volume came in for the week. The first area that I look is where old resistance areas were broken and what the volume distribution is in this area; high volume at 1183.00 (Support 2 area).
- The main weekly high volume area for its run is the 1167.50-1156.00 area (Support 3).
I hope that this example gave you some insight to my charting display. Please don’t hesitate to ask me any further questions. Good luck in your trading.
Click image for original size
Notice how ES has used the lower band of the high volume area for support(1186.50-1190.25)/ Monday's low;1189.25 / Tuesday low 1190.50
Hi chartex. Thanks for your detailed explanation. In your last posting, don't you mean the upper band of the high volume area for support?
Yes, I can see how this is playing out in the ES.
Do you have any specific strategies that you have tested with the volume at price. For example, have you tested to see if a reverse trade off the last week's highest volume price with a stop of say X points will yield a profit of the same size (X points) a certain % of the time. I would be very interested in strategies such as this.
Many thanks.
George Soros
Hi george,
Yes, I meant the upper band, but I will also keep the lower band for support.
I am a technician. I give my market numbers to my husband who trades with them on the CBOT floor. I use the volume numbers to confirm my support/resistance numbers. Also in congestion area I like to be able to pinpoint where the volume is.
I will use chart-ex charts for real time price action confirmation. I like to see how the market reacts to high/low volume areas. If the market will go through low cumulative volume areas I feel that it will continue its move and test the next high volume area.
When the market enters a high volume area I gauge the retracements, if they are small, the market will not use this volume area,if the retracements are large, the high volume area will be confirmed. This of course is not a gaurenteed observation.
I know that this is not a definte formula, but it enables me to get a better feel of the markets real time dynamics coming into play.
Thank you for taking your time using Chart-Ex and asking me questions.
The ES held the high volume area again today. I dont' like it if it stays in this area too long.
quote:
Originally posted by chartex
I am a technician. I give my market numbers to my husband who trades with them on the CBOT floor. I use the volume numbers to confirm my support/resistance numbers. Also in congestion area I like to be able to pinpoint where the volume is.
Thanks chartex. This is very interesting how you use this stuff. What instruments does you husband trade? And would it be possible for you to show me (even after the day is over) the numbers that you gave him and how you came by those numbers using the chartex charts and how he used them.
It is the dirrect application of this information that would be useful to me (and I am sure others).
I assume that he does not trade the ES because he trades at CBOT?
quote:
I will use chart-ex charts for real time price action confirmation. I like to see how the market reacts to high/low volume areas. If the market will go through low cumulative volume areas I feel that it will continue its move and test the next high volume area.
So what would be a possible strategy using the "low cumulative volume area"? What I assume that you are looking for here is a breakout/breakthrough of this area. In order to profit from that you need to get on board at some point.
So say the market begins to trade at the far edge of a "high cumulative volume area" and is heading towards a "low cumulative volume area". At some point you need to get on board that trade and take the risk that we are going to test a break-through of that area. We also need to define a risk tolerance and decide when the high volume area is going to hold and trade back into it.
Are there other tools and techniques and methods that you use here. I'm finding this very interesting but still a little bit theoretical and I'm trying to form some structured concepts in my mind that I could test and try in the markets even if it was in a paper trading mode to start with.
quote:
When the market enters a high volume area I gauge the retracements, if they are small, the market will not use this volume area,if the retracements are large, the high volume area will be confirmed. This of course is not a gaurenteed observation.
Where do you measure the retracements from? What part of the high volume area? The other side from the initial entry? The middle?
quote:
I know that this is not a definte formula, but it enables me to get a better feel of the markets real time dynamics coming into play.
Yes I realize that and I know that I am asking a lot here and understand that you are not trying to define a strategy but give some idea of areas of support and resistance: so I apologize for asking so many questions but I think that I could use these charts to improve my strategies but I need to formulate a way to do that and that is why I am asking so many questions.
quote:
The ES held the high volume area again today. I dont' like it if it stays in this area too long.
What is it that you do not like about the ES holding the high volume area? Does that tell you that the probability for a sideways market has increased and therefore it is more difficult to get directional trade out of the market?
Many thanks for all your answers.
George Soros
quote:
Thanks chartex. This is very interesting how you use this stuff. What instruments does you husband trade? And would it be possible for you to show me (even after the day is over) the numbers that you gave him and how you came by those numbers using the chartex charts and how he used them.
It is the dirrect application of this information that would be useful to me (and I am sure others).
I assume that he does not trade the ES because he trades at CBOT
My husband trades Meal on the floor. I think that if you would like to see how I apply chart-ex, it might be best to use ES. The correlation of my thoughts with you trading ES would be a better fit; more direct.
I am assuming that is what you trade.
quote:
So what would be a possible strategy using the "low cumulative volume area"? What I assume that you are looking for here is a breakout/breakthrough of this area. In order to profit from that you need to get on board at some point.
So say the market begins to trade at the far edge of a "high cumulative volume area" and is heading towards a "low cumulative volume area". At some point you need to get on board that trade and take the risk that we are going to test a break-through of that area. We also need to define a risk tolerance and decide when the high volume area is going to hold and trade back into it.
If I see that the market "run" through a low volume area I feel that the traders aren't there. The distribution of the low/high volume areas will differ often. So I will adjust my expectations. (I find it helpful to see what type of volume area the close was in and what kind of volume is around it).
This I will show in my futures examples.
quote:
Where do you measure the retracements from? What part of the high volume area? The other side from the initial entry? The middle?
I prefer to use the top or bottom area. But again the whole area is important. If the market uses the top part, I feel that there is more strength, if the market chips away and uses the lower part, I would move my stops closer.
quote:
What is it that you do not like about the ES holding the high volume area? Does that tell you that the probability for a sideways market has increased and therefore it is more difficult to get directional trade out of the market?
If the ES is in a flag formation, the mast shouldn't get too big.(Top heavy)
If you have an interest we can start next week, this weekend is a long weekend for me.
I will tell you how I use chart-ex and what I see and you give me feedback.
We can see if this is helpful for you.There are never ending dynamics that come into price action and why you as a trader make a market decision. So nothing is gaurenteed
Excuse my miss use of how to put your words in "quotes". This is new to me.
quote:
Originally posted by chartex
Excuse my miss use of how to put your words in "quotes". This is new to me.
Hi chartex,
A tip on using quotes which I'm sure that others will find useful as well:
If I want "my quoted text" to appear in a quoted section then I put the square bracketed word "quote" at the beginning and the same at the end except the word at the end in the square brackets has a / in front of it to show the end.
So:
[quote]my quoted text[/quote]
Will come out like this:
quote:
my quoted text
Hope that this helps.
I see that you've mastered smileys
I do like 1217.00 as resistance. I would alco look at 1211.00. From a bar chart you can guage the area but using chart-ex with the volume at price you can "zero" in.
I like how you are comparing time frames. When I comare time frame, I compare the previous days high/low to its close and yesterdays high/low it the previous days close. This gives me a comparsion/relative strength of the high/lows to the close.
I like how you are comparing time frames. When I comare time frame, I compare the previous days high/low to its close and yesterdays high/low it the previous days close. This gives me a comparsion/relative strength of the high/lows to the close.
Emini Day Trading /
Daily Notes /
Forecast /
Economic Events /
Search /
Terms and Conditions /
Disclaimer /
Books /
Online Books /
Site Map /
Contact /
Privacy Policy /
Links /
About /
Day Trading Forum /
Investment Calculators /
Pivot Point Calculator /
Market Profile Generator /
Fibonacci Calculator /
Mailing List /
Advertise Here /
Articles /
Financial Terms /
Brokers /
Software /
Holidays /
Stock Split Calendar /
Mortgage Calculator /
Donate
Copyright © 2004-2023, MyPivots. All rights reserved.
Copyright © 2004-2023, MyPivots. All rights reserved.