CHART-EX WEEK VS DAY CHART 181
Click image for original size
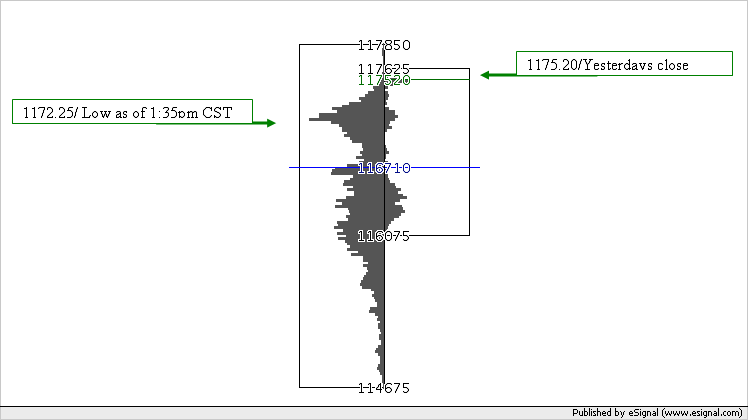
CHART-EX WEEK VS DAY CHART
MAY 10-16, 2005 VS. MAY 17, 2005
The above Chart-Ex chart displays the trading ranges and cumulative volume at price for the time frame;
Week = May 10-16, 2005
Day = May 17, 2005
- As of 1:35 pm CST, May 18, 2005, the delayed quote for the E-MINI S&P 500 05JUN is HIGH=1189.50, LOW= 1172.25, LAST=1185.50
- As you can see from the chart, the EMINI S&P 500 used the first high volume area below 1175.20 (yesterday’s close) for its support.
- The CHART-EX WEEK VS DAY java chart displays weekly high volume area at 1172.25 (today’s low as of 1:35 pm CST).
- As the market was approaching it’s daily low today, traders were able to use the weekly high volume accumulation as a support/buy signal area.
quote:
Originally posted by chartex
My husband trades Meal on the floor. I think that if you would like to see how I apply chart-ex, it might be best to use ES. The correlation of my thoughts with you trading ES would be a better fit; more direct.
I am assuming that is what you trade.
Yes, I only trade the ES.
quote:
...I find it helpful to see what type of volume area the close was in and what kind of volume is around it...
That's interesting. So what do you feel about a close in (1) a high volume area versus a close in (2) a low volume area?
quote:
I prefer to use the top or bottom area. But again the whole area is important. If the market uses the top part, I feel that there is more strength, if the market chips away and uses the lower part, I would move my stops closer.
Okay, so you're saying that support/resistance at the other side of the high volume area is weaker then?
quote:
If the ES is in a flag formation, the mast shouldn't get too big.(Top heavy) If you have an interest we can start next week, this weekend is a long weekend for me. I will tell you how I use chart-ex and what I see and you give me feedback.
That would be great, perhaps we could work through some examples and strategies?
quote:
...So nothing is guaranteed
I fully understand that. It's just a matter of probabilities. Even a 90% probable setup fails 1 time out of each 10 times we see it.
Thanks for your help.
George
For today's price action for ES;
* Since the market opens off the close, I zero in this area...I look at the closing price, volume distribution around the closing price for all time periods, and relative daily, weekly and monthly highs/lows by the closing price.*
Next I gauge the days trading range for the day, week and month. New highs were made yesterday. I check to see where the volume came in in this area, which is 1206.00, I will also use the numerical high price 1207.00. This give me a resistance area of 1207.00-1206.00.
Next I see from a bar chart that the market has had highs in the 1200.00 area, I find the top area of the high volume is;R1=1203.50. (So far today the market has used 1203.50 for its high)
Below the closing price of 1201.20 I see that volume drops off for yesterday's trade at 1198.50, but I also see good weekly volume accumulation until 1197.75. So I will make the support area of 1198.50-1197.75
I feel that yesterday's low of 1191.75 is important because it stayed above the previuos day's low of 1191.50. I guage the volume distribution in this area to get a support area of 1192.25-1191.25.
These are my thoughts today. Look forward to your feedback.
Lisa
Hi Lisa,
Thanks for your comments. It is becoming clearer now how you use this as a tool. It looks like this is just 1 of many tools that you use in creating a profile or picture of the market before it opens. I notice that you also use floor pivots.
There are so many things to watch when trading that it's difficult to know what parts to pull in and when a situation arises that one bit of information (for example the volume at price) suddenly becomes more important and should have extra weight attached to it.
I've heard people speak of Volume Weighted Average Price. Do you ever consider this number? I assume that all the information is on the chart ex charts to calculate it.
Thanks again.
George
Hi George,
I am glad that you are able to see how to use chart-ex.
You are right, the dynamics of the markets price action are infinte and elusive. That is why I like to use chart-ex; it gives me confirmation to my market numbers. I wrote an article that might be of interest ot you. Here is the URL:
http://www.cbot.com/cbot/pub/cont_detail/0,3206,1063+21303,00.html
I look forward to your feedback.
I don't look at volume weighted average price. That might be a good enhancement for me to add to chart-ex, would that be of interest to you to use for your trading decisions?
Take note of where ES closed; in the middle of the weekly high volume area and above Friday's high volume area.
Lisa
Hi Lisa,
That's an interesting article and nicely sums up what you are saying. Also good write up about yourself.
I don't know if the vwap would be of interest to me because I don't know how to use it. I just heard a lot about it and thought that the volume concept fitted in with your charts and thought that you may have more information on it.
George
Hi George,
Thank you for your kind words. I am glad the article gave you more insight.
I think that the vwap might be a good addition to allow traders to "zone" in a volume accumulation. I am quite busy now, but this something that I will work on.
I see that ES is still in its trading range. The advantage of using chart-ex in this trading range is that it pin points were the trades are taking place, that should make support or resistance for once it breaks. Also you can see when the market starts to make its move out its range (real time) how it reacts to the high/low volume area.
Lisa
On Friday the Sep05 ES broke out of its sideways trading range, on the up side. The volume area that I like is 1212.00. You can see on the week vs day chart and the month vs day chart this is the top of the high volume area.
I see what you are talking about - so this is a break out long then...?
Question: I see on the web site that the title (in yellow) for the ES charts is 05Jun but I assume that this is wrong and that it should be 05Sep?
Also, on the Month vs Day chart, is all the data on the volume/price part of the month now for the Sep contract or does it still have data in it from the Jun contract?
Thanks for the help Lisa
HI George,
Long term depends on your time frame. I think the market has built a solid base to step up. However, there is some resistance slightly above the new monthly highs that is shown a standard monthly bar chart. Chart-Ex unfortunatley is limited on its time frame. In the near future I am going to give the user more flexiability.
ES is now displaying Sep05, earlier today it showed Jun05 but we have added in the right hand side above the charts, contract month selection options. I selected the Sep05 month for my volume call.
The volume that is displayed is for "that" time period; Sep05 monthly volume is just for the volume in the Sep05 contract. No volume roll overs.
Do you feel that the market is building a solid base?
Best Regards,
Lisa
Hi Lisa - sorry about my delayed response - I was away for a while.
Yes - at the time you wrote that I completely agreed with you. It also looked like the market confirmed that in the ES by trading sideways for 3.5 days and only in the second half of yesterday did it fall apart.
I see how 1218.25 (high volume for Wednesday) formed both support and resistance yesterday (Thursday) before the market broke.
If the market does stage a recovery today (Friday) then I would guess that yesterday's high volume at 1217.00 would be a crucial resistance point and a place to take profits and possibly reverse a long trade.
Thanks for all your help Lisa - I am learning but slowly. These tools look good but it looks like they take time and effort to learn (which I am prepared to do) but there are no basic strategies to be applied to the chart-ex stuff.
For example: Have you noticed anything that happens more often than not around the high volume price the next day. i.e. is there a strategy that could be applied to just that level?
I do like 1217.00 as resistance. I would alco look at 1211.00. From a bar chart you can guage the area but using chart-ex with the volume at price you can "zero" in.
I like how you are comparing time frames. When I comare time frame, I compare the previous days high/low to its close and yesterdays high/low it the previous days close. This gives me a comparsion/relative strength of the high/lows to the close.
I like how you are comparing time frames. When I comare time frame, I compare the previous days high/low to its close and yesterdays high/low it the previous days close. This gives me a comparsion/relative strength of the high/lows to the close.
Emini Day Trading /
Daily Notes /
Forecast /
Economic Events /
Search /
Terms and Conditions /
Disclaimer /
Books /
Online Books /
Site Map /
Contact /
Privacy Policy /
Links /
About /
Day Trading Forum /
Investment Calculators /
Pivot Point Calculator /
Market Profile Generator /
Fibonacci Calculator /
Mailing List /
Advertise Here /
Articles /
Financial Terms /
Brokers /
Software /
Holidays /
Stock Split Calendar /
Mortgage Calculator /
Donate
Copyright © 2004-2023, MyPivots. All rights reserved.
Copyright © 2004-2023, MyPivots. All rights reserved.