CHART-EX WEEK VS DAY CHART 181
Click image for original size
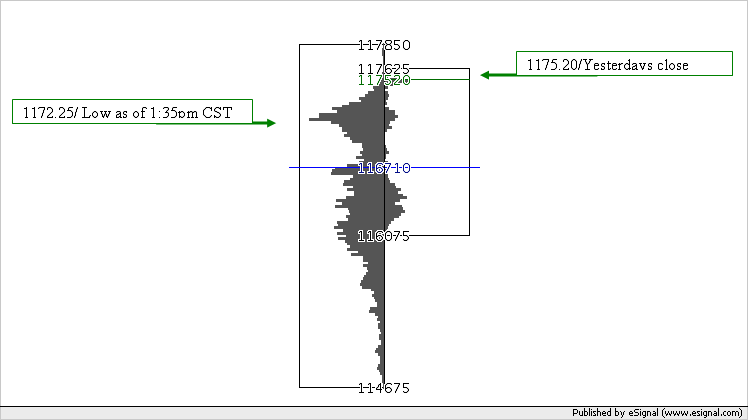
CHART-EX WEEK VS DAY CHART
MAY 10-16, 2005 VS. MAY 17, 2005
The above Chart-Ex chart displays the trading ranges and cumulative volume at price for the time frame;
Week = May 10-16, 2005
Day = May 17, 2005
- As of 1:35 pm CST, May 18, 2005, the delayed quote for the E-MINI S&P 500 05JUN is HIGH=1189.50, LOW= 1172.25, LAST=1185.50
- As you can see from the chart, the EMINI S&P 500 used the first high volume area below 1175.20 (yesterday’s close) for its support.
- The CHART-EX WEEK VS DAY java chart displays weekly high volume area at 1172.25 (today’s low as of 1:35 pm CST).
- As the market was approaching it’s daily low today, traders were able to use the weekly high volume accumulation as a support/buy signal area.
I've also just noticed that yesterday's range was 55% of the previous month's range and that it was 125% of the previous week's range - in the ES that is. I don't think that your charts are designed to show that but it's a very good visual representation of the previous trading session's size in comparison to the day before, week and month.
I do like 1217.00 as resistance. I would alco look at 1211.00. From a bar chart you can guage the area but using chart-ex with the volume at price you can "zero" in.
I like how you are comparing time frames. When I comare time frame, I compare the previous days high/low to its close and yesterdays high/low it the previous days close. This gives me a comparsion/relative strength of the high/lows to the close.
I like how you are comparing time frames. When I comare time frame, I compare the previous days high/low to its close and yesterdays high/low it the previous days close. This gives me a comparsion/relative strength of the high/lows to the close.
Emini Day Trading /
Daily Notes /
Forecast /
Economic Events /
Search /
Terms and Conditions /
Disclaimer /
Books /
Online Books /
Site Map /
Contact /
Privacy Policy /
Links /
About /
Day Trading Forum /
Investment Calculators /
Pivot Point Calculator /
Market Profile Generator /
Fibonacci Calculator /
Mailing List /
Advertise Here /
Articles /
Financial Terms /
Brokers /
Software /
Holidays /
Stock Split Calendar /
Mortgage Calculator /
Donate
Copyright © 2004-2023, MyPivots. All rights reserved.
Copyright © 2004-2023, MyPivots. All rights reserved.