The pitbull alert zones....
EDIT****** I began updating this thread on page 5 ******
I originally had this posted before the market opened in the Traders Lounge but I think it would be better off here......zones are created off one minute high volume bars in this volatility from the previous days session and the overnight....
"Where I'll be looking for entries.....I was biased to the upside when I saw the lower prices in the overnight but I missed all entries....( market just backed away from the 32 area, down at 27 as I type so this area is critical).anyway here is what I see in the ES. The weekly pivot sits down in the 1320 area.....The range of the prior week is tested in the real time session a very high percentage of the time. The other thing I am aware of is that the fed meeting is coming and some may front run that to get long....so my preference is to buy at lower prices today....Your results may vary!!!!
1352 - 1355
1342 - 1345
1330 - 32.50
Since all these numbers are based off of volume I believe that they will act as magnets...and the standard support/ resistance rules apply...
1320 - 1324
1314 - 14.50
Some come close to the Value areas as posted on this site...good trading
Bruce
"
I will post some chart examples and further ideas hen I have more time...
Hello Bruce
Thank you for posting your information and thoughts. Can you please explain the volume patterns you see.
thank you
Trader
Thank you for posting your information and thoughts. Can you please explain the volume patterns you see.
thank you
Trader
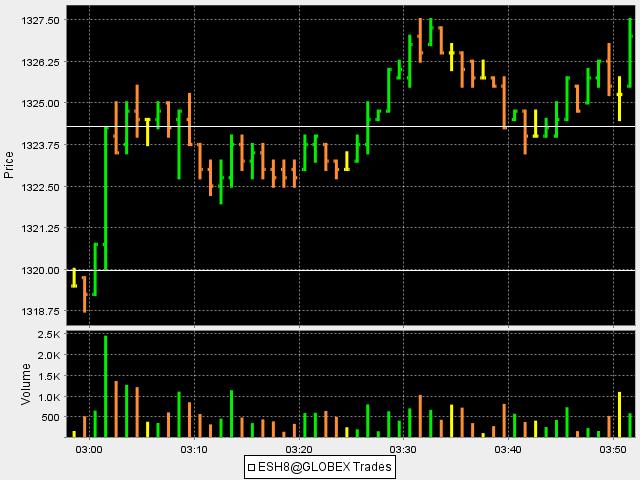
here is a close up of the zone that was created in the overnight...notice the large buying spike with volume.....in general these will indicate new buying coming in or exhaustion...so you snap a line at the highs and lows......
Notice how much time is spent above or below one of these zones....
notice if we are getting full one minute bars above or below these zones to signal a change of trend....just some thoughts to ponder.....snap these same lines in the current day session....see what happens....
Notice how much time is spent above or below one of these zones....
notice if we are getting full one minute bars above or below these zones to signal a change of trend....just some thoughts to ponder.....snap these same lines in the current day session....see what happens....
Click image for original size
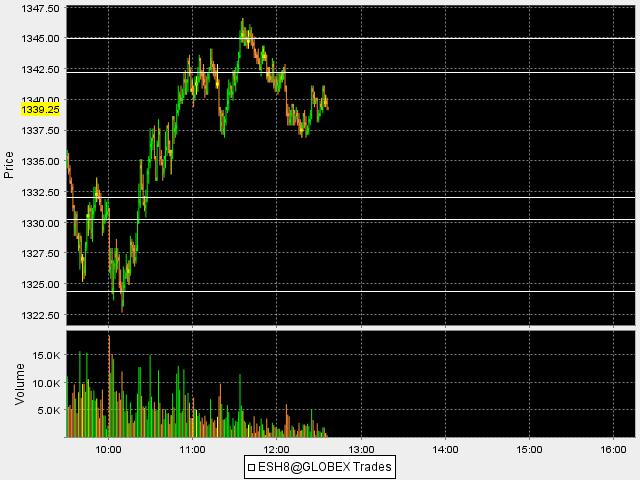
here is what is happening currently with those zones put on the day session....for a simple example....we haven't spent much time above the 45 number which is the far end of that zone....so the market declined....just a thought to get folks thinking
Click image for original size
Now this is really cool....we had an intra day spike form so I snapped a line at the one minute high and low of the volume spike bar..( 1347.50 - 1349)..at about 13:22 on the attatched chart.....the market goes up and comes within .50 points of our next alert zone at the 1352 area and then we spend very little...time above the new alert zone that was created intra day....we get the sell off...note the retest of the low of the new alert zone at about 15:05....so the new alert zone becomes resistence after it is broken....
Does any of this make sense? I can't explain things too well sometimes....
anyway this thread is about alert zones and I'm not going to get into particular entry techniques here...I think there are enough of those out there on the web....
You will also notice that the spike bar on the downside at 14:50...it's high was never violated so that was a hint that the short side might still be valid
An idea for some.....What happens when we trade, close and full bars form below a spike bar that forms on the upside? What happens when we trade above a spike bar that is created to the downside...?What happened this morning???
Click image for original size
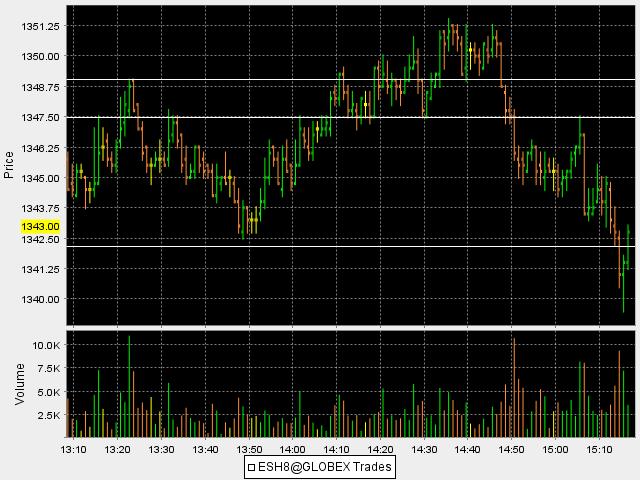
now add in your knowledge of the value area concepts and your set for take off.....VA high is 1351 for today
in general I have found that volume will come into the market ahead of key numbers and then dries up at the numbers and a counter trend move happens...
So...
If we come to a number from below it and we start getting volume spikes on up bars then look for volume to subside at/near the number and a countertrend short to develop
If we come to a number from being above it and we start getting volume spikes on down bars then look for a countertrend up move to develop..
This makes sense as the smart money is getting into positions ahead of time and buying into declines or selling into rallies...
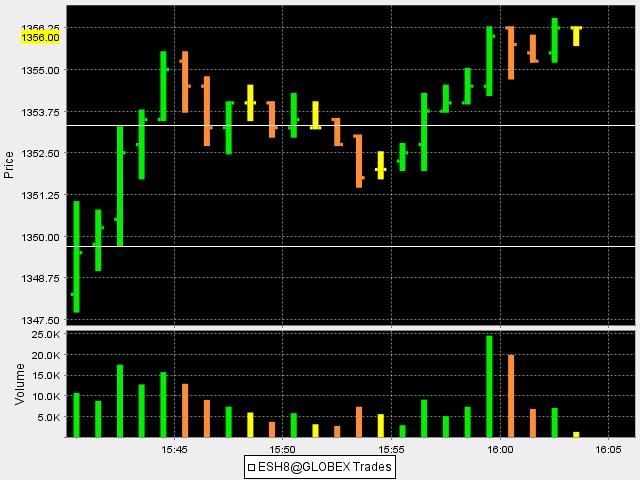
this is cool as we have that huge volume into that key zone.at about 15:42..but look what happens...we are unable to get below the low of the bar that created the strong volume push.......this is just like the initial chart I posted on this thread from the overnight...this implies continuation...you basically would like to erase all the high volume players quickly if your counter trend trade is going to work...in this case you would have liked to get below that low of the high volume bar..for shorts to work better.... this basically became a bull flag...and volume went even higher on the next push up...some could have sold the 1355 and still made some money or took the trade below the low of the highest vertical bar after the push up to get short....depends on your time frame and risk..
Click image for original size
This topic is an excellent real time / real life working example of zones. Many thanks Bruce.
Thank you Bruce!!!
my key zones as I type...
1372 - 1375
1360 - 65.50.....BIG zone...must stay above 1365 for any rally to hold...
1351 - 1353.50
1347.50
1335-1337.50
1327 - 1330
..personally I'm looking to sell the rallies..we need to get and stay under 1360 for any meaningfull selling to happen
Bruce
1372 - 1375
1360 - 65.50.....BIG zone...must stay above 1365 for any rally to hold...
1351 - 1353.50
1347.50
1335-1337.50
1327 - 1330
..personally I'm looking to sell the rallies..we need to get and stay under 1360 for any meaningfull selling to happen
Bruce
OK, I wanted to get back to this thread once I purchased a microphone that worked....I made a video for the day trading threads last week which can be found here in case you haven't seen it
http://www.mypivots.com/board/topic/6588/1/es-trading-4-6-11
But if you've already seen it then skip down to this new video I just made...It's basically demonstrating the same things but it involves somewhat of a trend day..not a classic trend day as we had that consolidation period in the middle......and don't forget to do a search on user "BeyondMP" he made some posts with additional ideas you may consider if you like volume.
Emini Day Trading /
Daily Notes /
Forecast /
Economic Events /
Search /
Terms and Conditions /
Disclaimer /
Books /
Online Books /
Site Map /
Contact /
Privacy Policy /
Links /
About /
Day Trading Forum /
Investment Calculators /
Pivot Point Calculator /
Market Profile Generator /
Fibonacci Calculator /
Mailing List /
Advertise Here /
Articles /
Financial Terms /
Brokers /
Software /
Holidays /
Stock Split Calendar /
Mortgage Calculator /
Donate
Copyright © 2004-2023, MyPivots. All rights reserved.
Copyright © 2004-2023, MyPivots. All rights reserved.