Chart Requested !!
Does anyone who has "real" charts have a lower time frame chart of this spike high at yesterdays high? I'm looking for something like a 10 second chart which would show volume.
My el-cheapo free IB charts just don't go lower than one minute and I'm too frugal ( It's my scottish heritage) to pay for more charts....
Thanks....
A failure at this spike high will target the 90 area again and then the 81 area....so far the overnight seems to be pointing to the 90 retest
No rush on this as the market opens in 15 minutes but I'd appreciate it when someone has time.
Bruce
Click image for original size
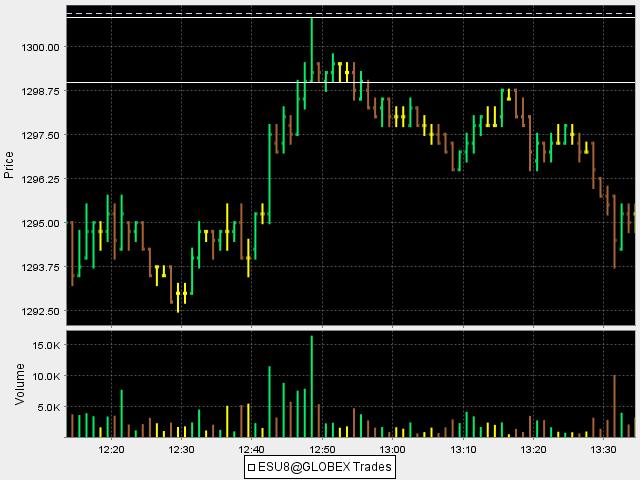
Like a giant pinball machine....tried to snap out of the high volume spike and rolled down to 90 area....the Ticks are doing an exact opposite of yesterday...so for me selling into the rallies is the way to go....up near this 98 area
Bruce - here is the tick file for the ES for that time period yesterday. I'm guessing that this has all the info you need?
Here is the key to the columns in the file:
T - Trade
080814 - Date: 08/14/08
000027 - time: 00:00:27
1286.75 - Price at which trade took place
1 - Number of contracts traded
Here is the key to the columns in the file:
T - Trade
080814 - Date: 08/14/08
000027 - time: 00:00:27
1286.75 - Price at which trade took place
1 - Number of contracts traded
Click link to access uploaded file:
Ticks-for-ES-for-14-Aug-2008-for-high.zip
Ticks-for-ES-for-14-Aug-2008-for-high.zip
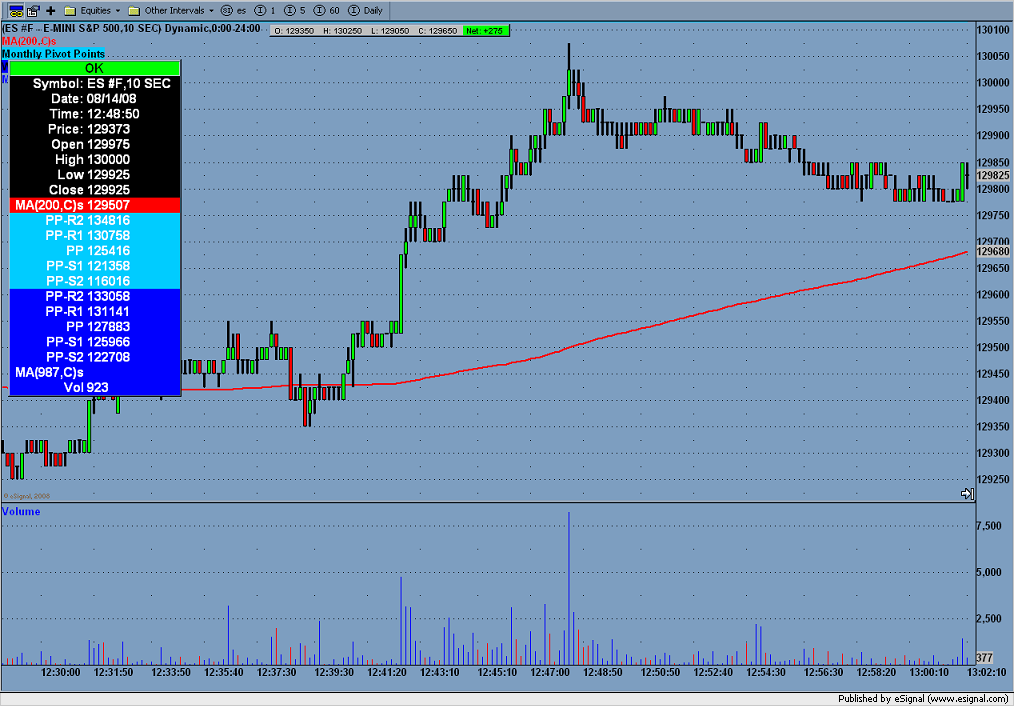
BruceM is this what you looking?
Quote Tracker has nice charts and they're FREE
Quote Tracker has nice charts and they're FREE
Click image for original size
Ideally I'd like to have a visual as I am in the process of refining some entries to limit risk.......My thoughts are this:
If the one minute is showing these nice spikes then it makes sense to dial down to see where and at what specific price the big volume surge comes in at. Since I fade moves then taking breaks of these spikes on the shorter time frame ( even shorter then the minute I watch) may help me reduce my initial risk . I now have some free time so I'll check out the zip file to see if I can spot anything but If someone can ZOOM in on that spike on a lower time frame with volume below it then that would be great....perhaps I should get motivated and learn some new software..thanks for the suggestion.
I have a "complimentary" version of I/RT but it gets messed up with lower time frame data and real time MP. Works great on MP after the close though
Can't open it Inventor...
quote:
Originally posted by inventor
BruceM is this what you looking?
Quote Tracker has nice charts and their FREE
[file]005--08-15-2008,_08_24_02.jpg,432,,[/file]
BruceM I have it but maybe daytrade can tell me how to attach?????
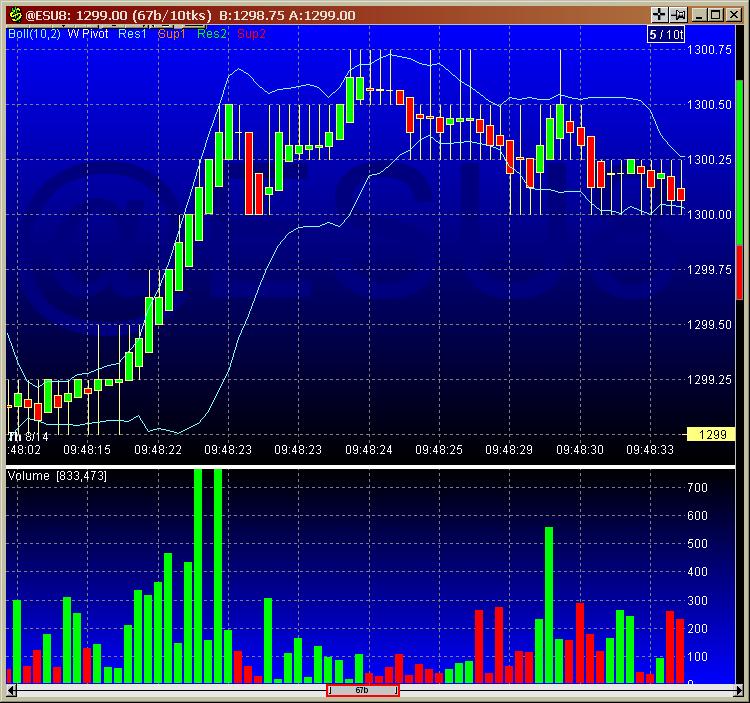
Click image for original size
Bruce here's a 10 sec of yesterdays high. If you really want to look into volme I recommend www.MarketDelta.com they have a free trai. 5 stars for volume analysis.
thanks to all for the help
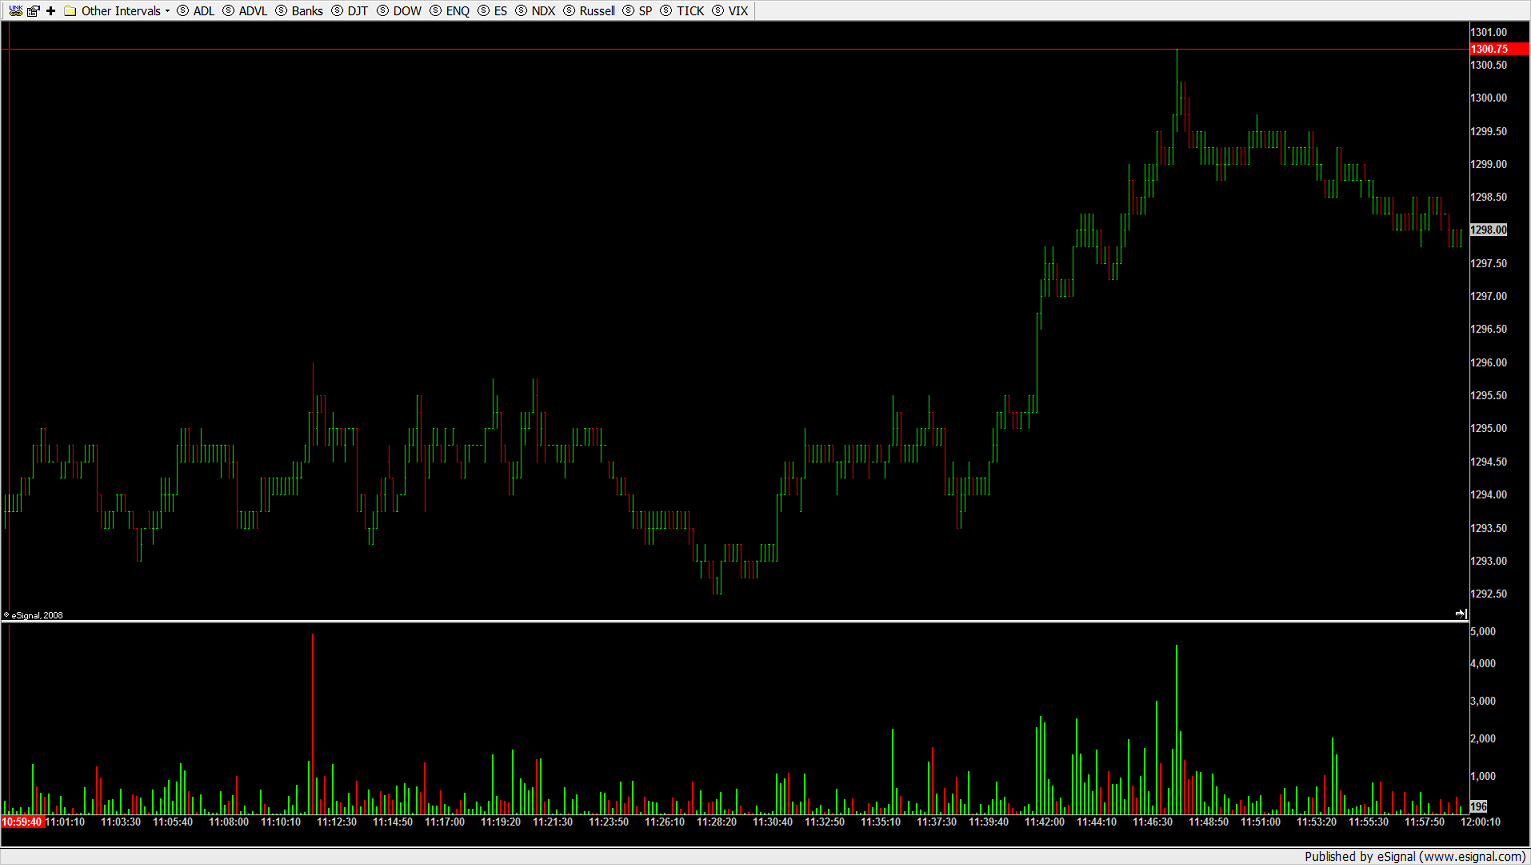
A slightly different angle for you, Bruce.
Click image for original size
quote:
Originally posted by inventor
BruceM I have it but maybe daytrade can tell me how to attach?????
inventor, the file name had a comma in it which is why it wouldn't display. I've fixed it now so you should see it now.
now I know who is taking all my money when I lose....It's you folks with the great charts....cool stuff.....LOL
I like the way the Ask Volume is so strong at the tops compared to sell Bid Volume......that makes sense...lots of promise there......
I would assume on key lows with high volume thrusts we will see the BId volume over powering the ASk...I've been around a long time and this is a path I seem to shy away from.....probably time for me to make a chart upgrade...thanks again
Bruce
Emini Day Trading /
Daily Notes /
Forecast /
Economic Events /
Search /
Terms and Conditions /
Disclaimer /
Books /
Online Books /
Site Map /
Contact /
Privacy Policy /
Links /
About /
Day Trading Forum /
Investment Calculators /
Pivot Point Calculator /
Market Profile Generator /
Fibonacci Calculator /
Mailing List /
Advertise Here /
Articles /
Financial Terms /
Brokers /
Software /
Holidays /
Stock Split Calendar /
Mortgage Calculator /
Donate
Copyright © 2004-2023, MyPivots. All rights reserved.
Copyright © 2004-2023, MyPivots. All rights reserved.