ES 12-18-08 CHARTS


Click image for original size
Click image for original size
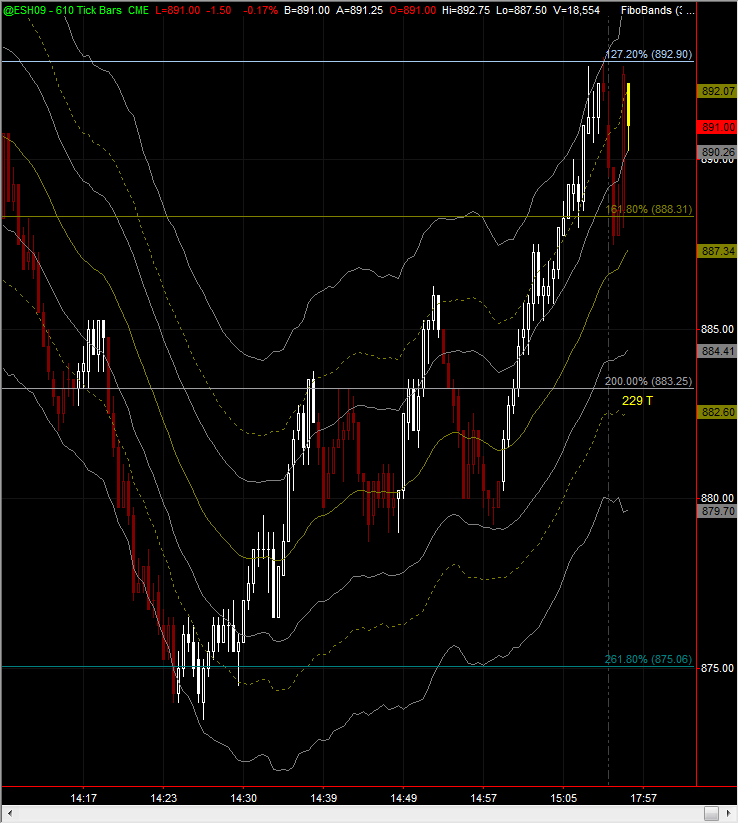
this is the terminal point of an ABC that completed at about 10:00 am (est)...the powerful 261.8% stopped the decline.
Click image for original size
Thanks VO,
How do you determine where to draw your a-b-c and projection? The reason I ask is because you have two charts with the same bars in the same time zone but yet you drew two different a-b-c points. This question really gets at the core of "How do we eliminate some of the discretion in drawing a-b-c-'s and projections...?
You may have a 2.6 on this time frame and a .38 on another and a 1.6 on another....we could go crazy snapping lines all over the place.....
I'm not trying to be a pain in the rear but I'm curious...it is one of the challenges I have with Fibs etc...
Great charts...
Bruce
VO & KB: you guys are doing a great job teaching us how to use these fibonacci projections.
VO: one question I have is the retracement from the 161.8 level, have you noticed if there is a % retracement back towards the starting point (A) we can look for, perhaps 50% ?
VO: one question I have is the retracement from the 161.8 level, have you noticed if there is a % retracement back towards the starting point (A) we can look for, perhaps 50% ?
Here is my chart from this morning...
Click image for original size
quote:
Originally posted by BruceM
Thanks VO,
How do you determine where to draw your a-b-c and projection? The reason I ask is because you have two charts with the same bars in the same time zone but yet you drew two different a-b-c points. This question really gets at the core of "How do we eliminate some of the discretion in drawing a-b-c-'s and projections...?
You may have a 2.6 on this time frame and a .38 on another and a 1.6 on another....we could go crazy snapping lines all over the place.....
I'm not trying to be a pain in the rear but I'm curious...it is one of the challenges I have with Fibs etc...
Great charts...
Bruce
Bruce thats actually a good question. I'm not sure there is a right or wrong answer but this is how I do it (so yes there is descetion).
ABC's are nothing more than the ebbs and flows of the market, or waves as Elliott dubbed them. I am always looking for a larger/smaller "degree" wave - that is one size bigger/smaller. Anytime price expands, be it upwards or downwards, I am interested in the retracement process. I am looking to see how far that corrective move is as measured by the fib ratios. Once that retrace is complete I immediately start looking for projections (targets) with the trusty fib extension tool.
Yes Bruce you will be putting a lot of retracement lines on your chart, but you will be erasing a lot as well. I have my fib retracement tool set to give me 38.2, 50, 61.8, 78.6, 88.6. It takes 2-3 seconds to do that. Once the retrace is complete I snap the projections on which takes 2-3 seconds. I have my fib extension tool set to give me 78.6, 100, 127.2, 161.8, 200, 261.8, 361.8, 423.6. Once I have those projections on I can simply click on the retracement numbers and delete them which takes me another 2-3 seconds. When do I get rid of my projection lines? When either 1.) price breaks through 423.6 (rarely) 2.) I give up on pattern (sometimes) 3.) price breaks a pivot H/L (usually).
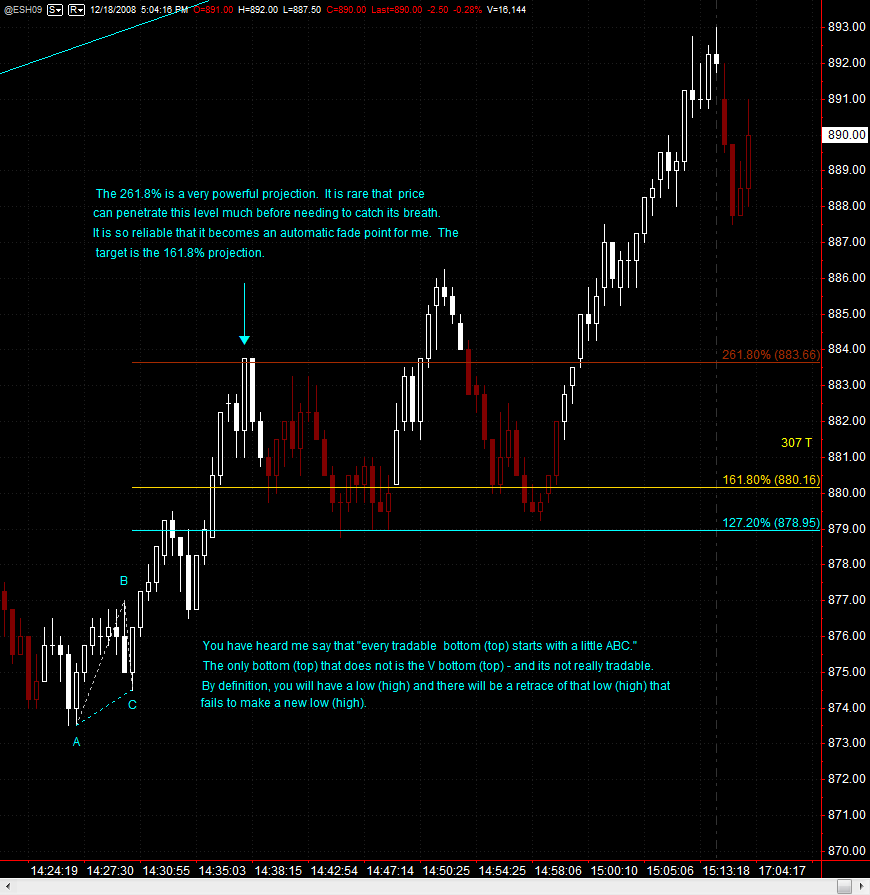
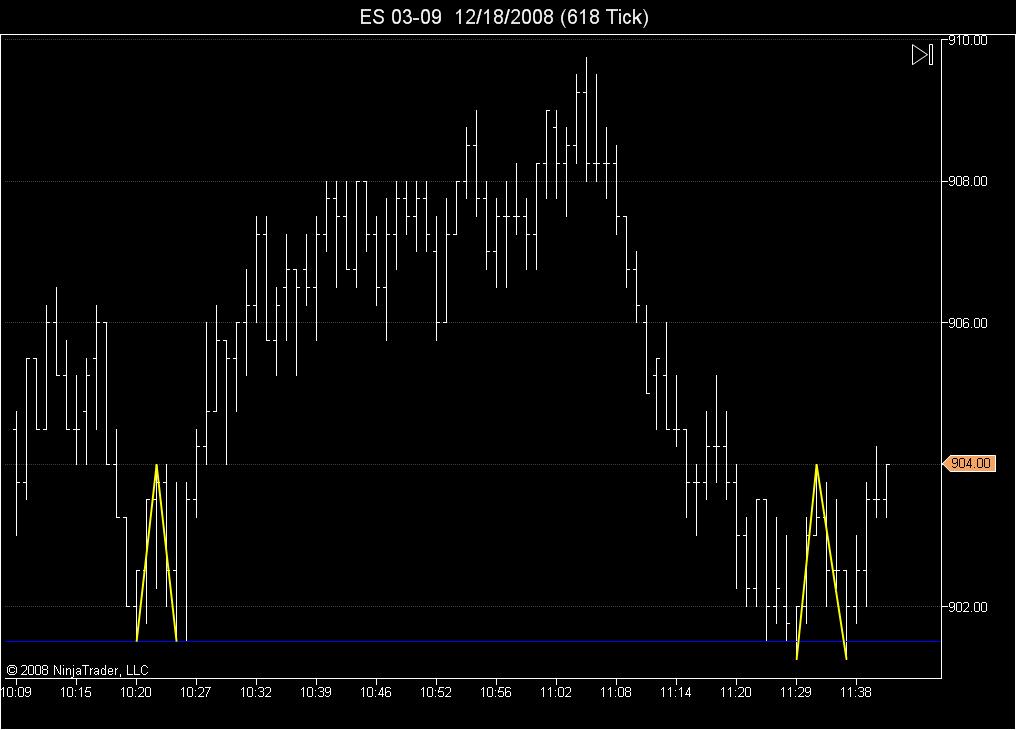
You specifically ask about the two ABC's posted in the charts. Which one do we use? After I drew the first ABC it immediately reached its second target at 127.2% (I use 1st-100, 2nd-127.2, 3rd-161.8) before starting a retrace. As I stated earlier, I am always on the lookout for the next degree wave. You will often times find that you end up with confluences of numbers. During the retrace once price started showing a positive candle I put the fib extension tool to work. I did not know at that point that the retrace was even complete, but I had my projections on and I could easily change my C point by just a click if price decided to continue down. This happens a lot where I end up changing my C point and sometimes several times just dragging it down/up with price. Once price CLOSED with a higher high CLOSE I was long @ 879 and posted "looking for 82.50 & 84". Once price hit the 261.8 from the 1st ABC it was immediately rejected. It retraced and gave it another try and didn't have the juice and needed another retrace this time taking out a pivot L. At this point I am done with that pattern. Now I still have the 2nd ABC in play and the start of a 3rd which I didn't post in chart(from the 261.8 reject and its retrace).
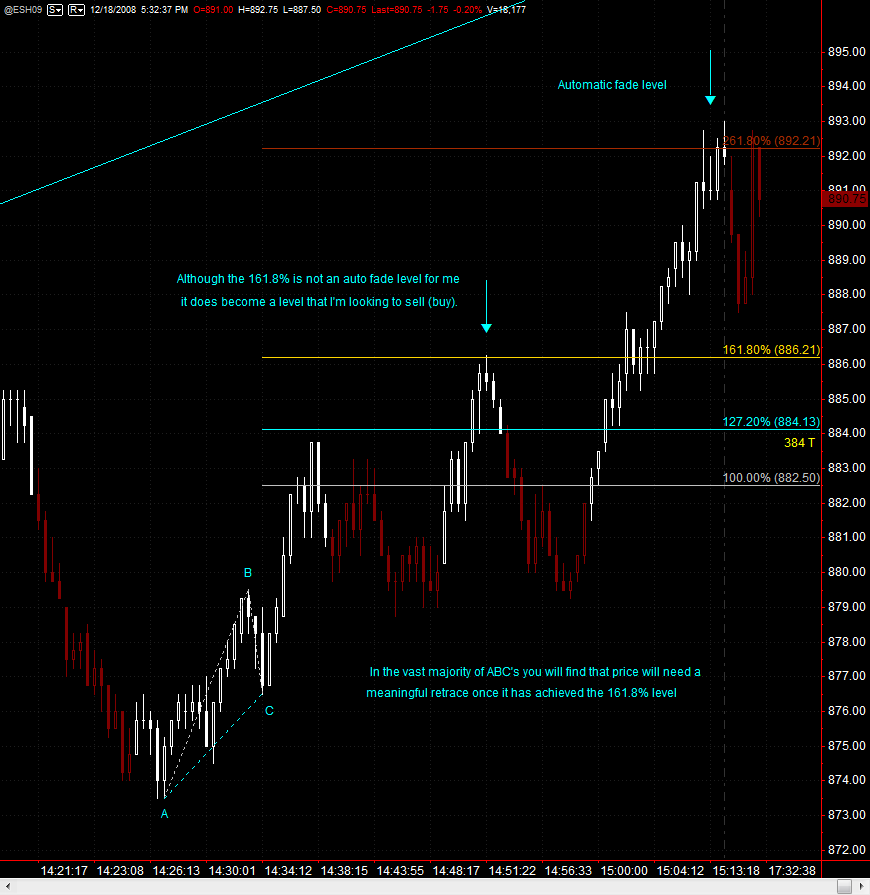
The 2nd ABC, which dead nutted its 161.8%, had a meaningful retrace and came close to taking out a pivot L. If it had taken that L out I would have been done with that pattern. It also gave me a 4th ABC! Draw the last 3 ABC's and see the confluence of numbers that sit around the 92-93 level. As I type this, price has rejected 2x's there and has gone back and bounced from the 161.8% level.
Bruce I draw them all (practically) and my charts are never so messy that I don't know which is which. I am always adding and subtracting retracements/expansions/extensions/projections/trendlines. I will say that there are times that I have to scrunch my chart down to see specifically where levels originated from. Like the 3rd chart I posted. That was a bigger picture ABC that had completed at around 10 am.
If that is to much, just do one at a time. That is how I started and learned. Or Bruce, you can simply just take and use the projections as confluences in your volume zones and not worry about the pattern. The projections are the same thing as KoolsTools. Hope this helps - if I have not answered your questions let me know and I will try and clarify.
Thank you VO, your help and explanations are greatly appreciated !
Emini Day Trading /
Daily Notes /
Forecast /
Economic Events /
Search /
Terms and Conditions /
Disclaimer /
Books /
Online Books /
Site Map /
Contact /
Privacy Policy /
Links /
About /
Day Trading Forum /
Investment Calculators /
Pivot Point Calculator /
Market Profile Generator /
Fibonacci Calculator /
Mailing List /
Advertise Here /
Articles /
Financial Terms /
Brokers /
Software /
Holidays /
Stock Split Calendar /
Mortgage Calculator /
Donate
Copyright © 2004-2023, MyPivots. All rights reserved.
Copyright © 2004-2023, MyPivots. All rights reserved.