Kool's Tool's for Time
Cycles
This article will put forth my theory on timing 'cycles' or swings in the market using a unique little trick I have successfully used for over ten years now. First a brief background on how it was discovered. Years ago I was an Elliot Wave groupie and while I had confidence in the theory, I found that to trade off of it was practically impossible. There were always 2 or 3 counts possible, etc. It did however open my eyes to certain patterns and I turned my attention to studying them . Cycles intrigued me, but like the waves, they were always stretching or compressing and so were also too inaccurate to trade off of. Then I discovered a simple little trick that I still use today with great success!
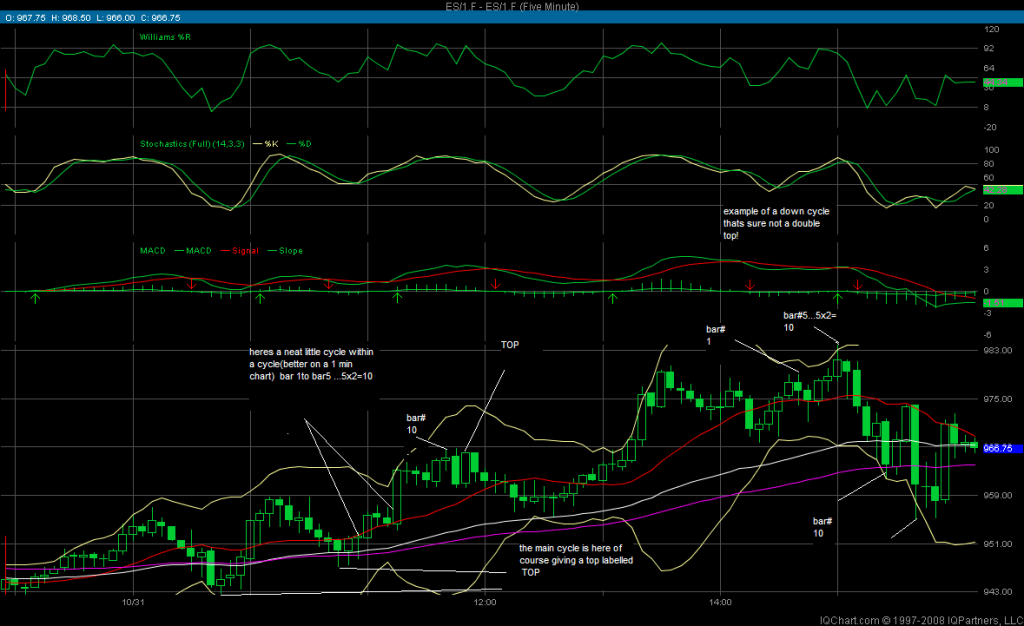
Basically , the theory is this. I count from any peak to the next peak. Let's say it's 10 bars. I multiply that by 2 to see where the low for that cycle is going to be. Not necessarily 'the low' but the low for that cycle. Same thing in reverse. Count low to low to get where the peak is (for that cycle). This is so simple a child could do it! The trick is that on some occasions I add one bar to my count . I'll get more in to that later. This works on all time frames any chart, any index, commodity, etc. I use this in tandem with some simple technical indicators (Williams %r and stochastic) to see if I want to buy or sell. I also use another discovery of mine, price projection which I cover the price article. Here's an example in real-time trading just this morning.
THIS CHART IS CURRENTLY MISSING
I know there's a lot on this chart but I'm new at explaining this as it's hard to do by writing as opposed to in person. After you absorb this chart check out the next one to see what happened next!
THIS CHART IS CURRENTLY MISSING
This article will put forth my theory on timing 'cycles' or swings in the market using a unique little trick I have successfully used for over ten years now. First a brief background on how it was discovered. Years ago I was an Elliot Wave groupie and while I had confidence in the theory, I found that to trade off of it was practically impossible. There were always 2 or 3 counts possible, etc. It did however open my eyes to certain patterns and I turned my attention to studying them . Cycles intrigued me, but like the waves, they were always stretching or compressing and so were also too inaccurate to trade off of. Then I discovered a simple little trick that I still use today with great success!
Basically , the theory is this. I count from any peak to the next peak. Let's say it's 10 bars. I multiply that by 2 to see where the low for that cycle is going to be. Not necessarily 'the low' but the low for that cycle. Same thing in reverse. Count low to low to get where the peak is (for that cycle). This is so simple a child could do it! The trick is that on some occasions I add one bar to my count . I'll get more in to that later. This works on all time frames any chart, any index, commodity, etc. I use this in tandem with some simple technical indicators (Williams %r and stochastic) to see if I want to buy or sell. I also use another discovery of mine, price projection which I cover the price article. Here's an example in real-time trading just this morning.
THIS CHART IS CURRENTLY MISSING
I know there's a lot on this chart but I'm new at explaining this as it's hard to do by writing as opposed to in person. After you absorb this chart check out the next one to see what happened next!
THIS CHART IS CURRENTLY MISSING
Cycles 2
I always look for the nice bowl shape or upside down bowl shape, depending if you want an up or down cycle. Note that there are thousands of cycles on any chart or at least as many as there are peaks and lows! I use technical indicators and price projection to narrow things down. Play around with it and you'll find it to be the most powerful tool you will ever use. I've had 2 losing days in the last 6 weeks or so and that was from impulsive 'chasing the market' not from the cycles. More coming in future articles.
Let me know what you think or if you understand since I'm not sure I'm very good at explaining. These charts are from the morning of 31 October 2008 when I was up 8 handles already. (In the previous session up 34 yesterday) I basically post my trades (mostly in advance and as they occur) in the trader's lounge, the ES thread.
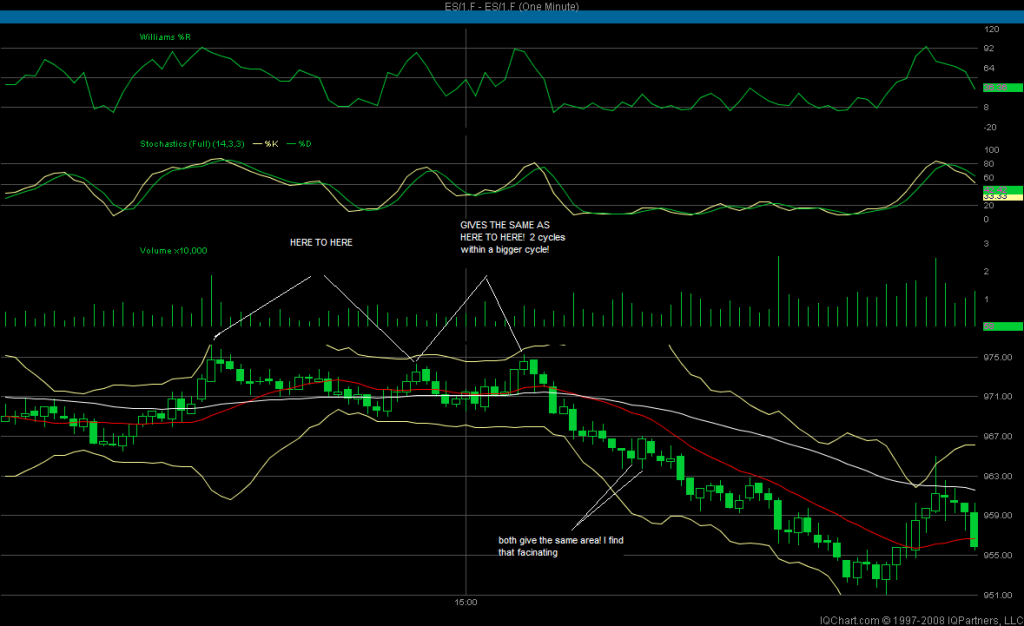
Later on this day, I was up 18 handles, and I'm not kidding, I don't even remember a losing week all year long! The only time I ever lose is cause I get bored waiting for a cycle and just chase a move impulsively. The beauty of my Kool's Tools is that no worries about an up trending, down trending or sideways market. No worries about cycles stretched or compressed. It takes some getting used to however. There are lots of rules on when to add a bar or not. Also it's cool to see how a cycle within a cycle will often give the same target. I use a 5min chart for the bigger picture and then when we get close I fine tune it with the 1 min chart. When you get the hang of it you can make some extraordinary calls! I do it every day in the trader's lounge. When you combine it with my price projection techniques, you can truly master price and time.
I kid you not it's the most powerful tool you ever have. WANT TO HAVE SOME FUN? Take a look at a monthly chart of the SPX and you'll see exactly when the madness ends! PS: it's not October of November
How did I know to get short at the 11:50 five-min bar (at 965.25)? I knew it half hour ago and just covered at 960.75 at 12:03 cause the 1 min chart told me to! Like taking candy from a baby! Now up over 23 handles and done for the day.
The real joy for me is not making money, that's really easy now, but to see all of the magic of Fibonacci relationships and techniques coming together in a fashion we may never fully understand but can always appreciate! Price and time, baby, price and time! Gann had the right idea, he just made it too complicated. RN Elliot had good insight , he just didn't go far enough! I feel like people like you and me carry on the torch of spending hours, months looking at charts, until we find patterns and relationships that later seem so obvious! More coming soon! In closing, I'm always wanting to learn more!
THIS CHART IS CURRENTLY MISSING
I always look for the nice bowl shape or upside down bowl shape, depending if you want an up or down cycle. Note that there are thousands of cycles on any chart or at least as many as there are peaks and lows! I use technical indicators and price projection to narrow things down. Play around with it and you'll find it to be the most powerful tool you will ever use. I've had 2 losing days in the last 6 weeks or so and that was from impulsive 'chasing the market' not from the cycles. More coming in future articles.
Let me know what you think or if you understand since I'm not sure I'm very good at explaining. These charts are from the morning of 31 October 2008 when I was up 8 handles already. (In the previous session up 34 yesterday) I basically post my trades (mostly in advance and as they occur) in the trader's lounge, the ES thread.
Later on this day, I was up 18 handles, and I'm not kidding, I don't even remember a losing week all year long! The only time I ever lose is cause I get bored waiting for a cycle and just chase a move impulsively. The beauty of my Kool's Tools is that no worries about an up trending, down trending or sideways market. No worries about cycles stretched or compressed. It takes some getting used to however. There are lots of rules on when to add a bar or not. Also it's cool to see how a cycle within a cycle will often give the same target. I use a 5min chart for the bigger picture and then when we get close I fine tune it with the 1 min chart. When you get the hang of it you can make some extraordinary calls! I do it every day in the trader's lounge. When you combine it with my price projection techniques, you can truly master price and time.
I kid you not it's the most powerful tool you ever have. WANT TO HAVE SOME FUN? Take a look at a monthly chart of the SPX and you'll see exactly when the madness ends! PS: it's not October of November
How did I know to get short at the 11:50 five-min bar (at 965.25)? I knew it half hour ago and just covered at 960.75 at 12:03 cause the 1 min chart told me to! Like taking candy from a baby! Now up over 23 handles and done for the day.
The real joy for me is not making money, that's really easy now, but to see all of the magic of Fibonacci relationships and techniques coming together in a fashion we may never fully understand but can always appreciate! Price and time, baby, price and time! Gann had the right idea, he just made it too complicated. RN Elliot had good insight , he just didn't go far enough! I feel like people like you and me carry on the torch of spending hours, months looking at charts, until we find patterns and relationships that later seem so obvious! More coming soon! In closing, I'm always wanting to learn more!
THIS CHART IS CURRENTLY MISSING
Cycles 3
Note, counting from the May peak to the August peak (1234) would seem to confirm December as the low. Either way December to January there will be a major low! Take it to the bank!
Theoretically, it's like RN Elliot's waves within waves within waves. almost like a house of mirrors! Any peak to any peak even within a move will telegraph its own little cycle end. What's cool is when you count a cycle, let's say from a 5 min chart and its end is maybe 25 min away. After say 10 min maybe you go to the 1 min chart while you're waiting. Suddenly you're counting a little cycle in the middle of the downtrend that your waiting for (which is now 15 min away, right?) and boom! its projected end for the smaller 'intra-cycle' cycle is at the same time! I call these confirmations. it happens in my price projection all the time and what a rush. I know I tend to get a little carried away, but sometimes it's almost 'spiritual' to make a trade like this when no one else in their right mind would. I can trade against or with a trend with equal effectiveness! And that's a big advantage over any other system I know of.
Where I fear most newbies to my work will go wrong is the first time or two when they call and trade a cycle dead nuts, they will just use this tool only, and that's a big mistake! There is no 'holy grail' in trading. This tool maybe powerful, but it is best used in conjunction with price projection theory and simple indicators like I use. The handful of people I've shown this to (you could count them on two hands) sometimes have that tendency. After all it's as addicting as hell, the first time you know that in 4 minutes the price will be say 2.25 handles lower or something and then likely bounce! It sometimes freaks me and I've been doing this for a few years!
You can start your count back 6 bars at the '946.9ish peak'. Continuing on my bar 1 is your bar 6 and so on till you get to bar 33 your next good peak. The problem of course is this is not a very' clean' cycle because bar 34 is also the same high! and in fact so is bar 36 and 37! So which do we use? And what is this telling us? My interpretation is that this is giving us a 'range ' for this particular cycle low from 33x2= bar 66 to bar 37x2= bar 74 .Probably not entirely useful to you if you're in a short trade, but let's see. If you just take the average of this range (74-66) you would get bar number 70, right? Do your count and bingo! But realistically, I would have exited at the first possibility (most conservative) exit bar 66 and missed a bit of that move. The point here is that there are virtually an infinite number of up and down cycles all occurring at the same time. This chart is a good example of that. At a glance I see at least 13 ups and down scalps possible. That's where your technical indicators, and price projections come in. They help you decide whether to be trying for a long (up cycle) or short (down cycle) but they all work! Remember , on any given cycle, there is no guarantee how far up or down for that matter! Again, that's where price projection and my moving averages and Bollinger come into play. But if used properly (in conjunction with the other tools) they will always keep you from getting 'burned' very badly. My intention in disclosing this simple little technique was to help others 'refine' their already existing methods. For instance, if already in a trade it might help you decide a good exit strategy, etc.

Cycles 4
I've carried these secrets around inside my head for years, and only recently decided to go 'public'. If you guys like this stuff, wait untill I get time enough to show you how I knew the ES market 'wanted' 984, and I knew it by 10:15 Friday morning! Actual price projection was 984.50, actual high was 984!

I've carried these secrets around inside my head for years, and only recently decided to go 'public'. If you guys like this stuff, wait untill I get time enough to show you how I knew the ES market 'wanted' 984, and I knew it by 10:15 Friday morning! Actual price projection was 984.50, actual high was 984!
In the chart above you see bar #26. Count backward to bar #20, a minor peak. Counting to the next good peak is bar #25 the actual price peak (as opposed to the closing peak #26). That's not like any double top I've ever seen! But if you start bar #20 as your bar #1 and count to that peak at bar #6 (was bar #25) you have 6x2=12 so bar #12 (on this charts labeling it would be #31) would be the low for that cycle. That's what I meant by a short at bar #25 would be good for a decline of at least 5 bars!
I miscounted! here's the correct chart! Perfect? no, but pretty dam good , eh?

I can't help but wonder if I could see just to the left of this chart a couple more bars, would I have nailed it? Sorry about the first chart, late night!
Genius? no..but innovator? YES! Nobody in the world uses such simple techniques, because whole industries have been built around fancy programs, systems, and high priced advisory letters! They're all going to hate this, but my motive is simply to show how one or 2 simple tools can make you just as successful as the most expensive computer program! Anyway, corny as it sounds, I just hope these 'Kools tools' help in your present systems! GOOD trading all!
With practice ,and experience you'll get better at this. No holy grail here! I mean, let's face it, if a method determines a low area within a bar or so, isn't that a powerful tool you can use in conjunction with your other technical indicators? Think of it this way, if 2 bars next to each other have nearly the same high which do you use? I guess the bottom line is, you don't know! I usually go with the bar that seems to start the cycle with force, but mindful of the fact that I could be off by 1-2 bars. That's where cross referencing with a shorter term chart can help. After all, on a five minute bar that appears to be a high, is the high made in the 1st min. or the 4th min? that could make a difference, right? So always use smaller term charts, for 'refining' the cycle as it nears completion. It would take a while to explain, but a candle can also give a clue as to the action on that particular bar.

Today's Action ...1 Min Chart PS : ( Vo ,stands for Vowater, a 'student' of my work in the forum, where we trade ,who is getting quite good at it)
Genius? no..but innovator? YES! Nobody in the world uses such simple techniques, because whole industries have been built around fancy programs, systems, and high priced advisory letters! They're all going to hate this, but my motive is simply to show how one or 2 simple tools can make you just as successful as the most expensive computer program! Anyway, corny as it sounds, I just hope these 'Kools tools' help in your present systems! GOOD trading all!
With practice ,and experience you'll get better at this. No holy grail here! I mean, let's face it, if a method determines a low area within a bar or so, isn't that a powerful tool you can use in conjunction with your other technical indicators? Think of it this way, if 2 bars next to each other have nearly the same high which do you use? I guess the bottom line is, you don't know! I usually go with the bar that seems to start the cycle with force, but mindful of the fact that I could be off by 1-2 bars. That's where cross referencing with a shorter term chart can help. After all, on a five minute bar that appears to be a high, is the high made in the 1st min. or the 4th min? that could make a difference, right? So always use smaller term charts, for 'refining' the cycle as it nears completion. It would take a while to explain, but a candle can also give a clue as to the action on that particular bar.
Today's Action ...1 Min Chart PS : ( Vo ,stands for Vowater, a 'student' of my work in the forum, where we trade ,who is getting quite good at it)
Cycles 5
I chose the points I chose because they were the highest points in that area.. i.e. The high I chose is higher than the high that others talk about. It just appears to be a 'bigger' and hopefully more important cycle. Also I had much lower price projection than the point at which the other cycle would be expected to bottom (or end, if you will). Do your count and it hits right between those two little lows at 963.75 and jumped to 967! You can say it was off by one bar but even if you took the trade at its expected low you would have had a couple of handles! Remember, you don't know how good the bounce will be! That's where price projection and technical indicators come into play. Finally, as it turns out I actually took that trade! went long at 965.00,missed jumping out at 967 and was stopped out at 953 I think, then immediately was looking for 959 if memory serves. Still had a pretty good day though! You can review it all at the forums. Hope this helps!
I chose the points I chose because they were the highest points in that area.. i.e. The high I chose is higher than the high that others talk about. It just appears to be a 'bigger' and hopefully more important cycle. Also I had much lower price projection than the point at which the other cycle would be expected to bottom (or end, if you will). Do your count and it hits right between those two little lows at 963.75 and jumped to 967! You can say it was off by one bar but even if you took the trade at its expected low you would have had a couple of handles! Remember, you don't know how good the bounce will be! That's where price projection and technical indicators come into play. Finally, as it turns out I actually took that trade! went long at 965.00,missed jumping out at 967 and was stopped out at 953 I think, then immediately was looking for 959 if memory serves. Still had a pretty good day though! You can review it all at the forums. Hope this helps!
Approach it with an open mind! Go to the last 2 trading days in the forum, and follow the posts on your charts and you'll see some amazing calls and probably understand why! Don't forget to have your 5 min charts up too though. I use both.

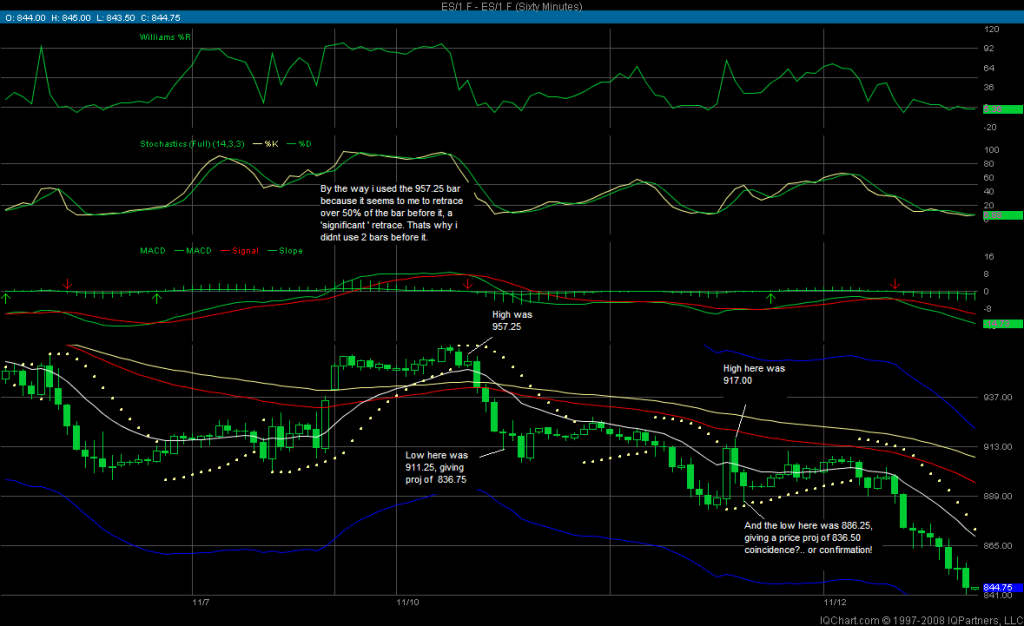
Look , the bottom line is there's no guarantee the 2 bar projection won't come to pass, but best guess is that the 2nd bar looks to me like its retraced, what, maybe 30% or so of the projection bar? Usually I tend to figure maybe 20% or less is not a 'significant' retracement. Of course, sometimes I'm wrong! That's one reason I usually refer to a one bar projection like this as an 'initial' projection to let others know a lower projection could be working!
Hi there,
Thanks for sharing this wealth of information. It has proven quite useful to me already.
In your tutorial links, like this one, the chart used as an example in post 1 is missing. Do you know where I may find it?
Thanks,
Thanks for sharing this wealth of information. It has proven quite useful to me already.
In your tutorial links, like this one, the chart used as an example in post 1 is missing. Do you know where I may find it?
Thanks,
Emini Day Trading /
Daily Notes /
Forecast /
Economic Events /
Search /
Terms and Conditions /
Disclaimer /
Books /
Online Books /
Site Map /
Contact /
Privacy Policy /
Links /
About /
Day Trading Forum /
Investment Calculators /
Pivot Point Calculator /
Market Profile Generator /
Fibonacci Calculator /
Mailing List /
Advertise Here /
Articles /
Financial Terms /
Brokers /
Software /
Holidays /
Stock Split Calendar /
Mortgage Calculator /
Donate
Copyright © 2004-2023, MyPivots. All rights reserved.
Copyright © 2004-2023, MyPivots. All rights reserved.