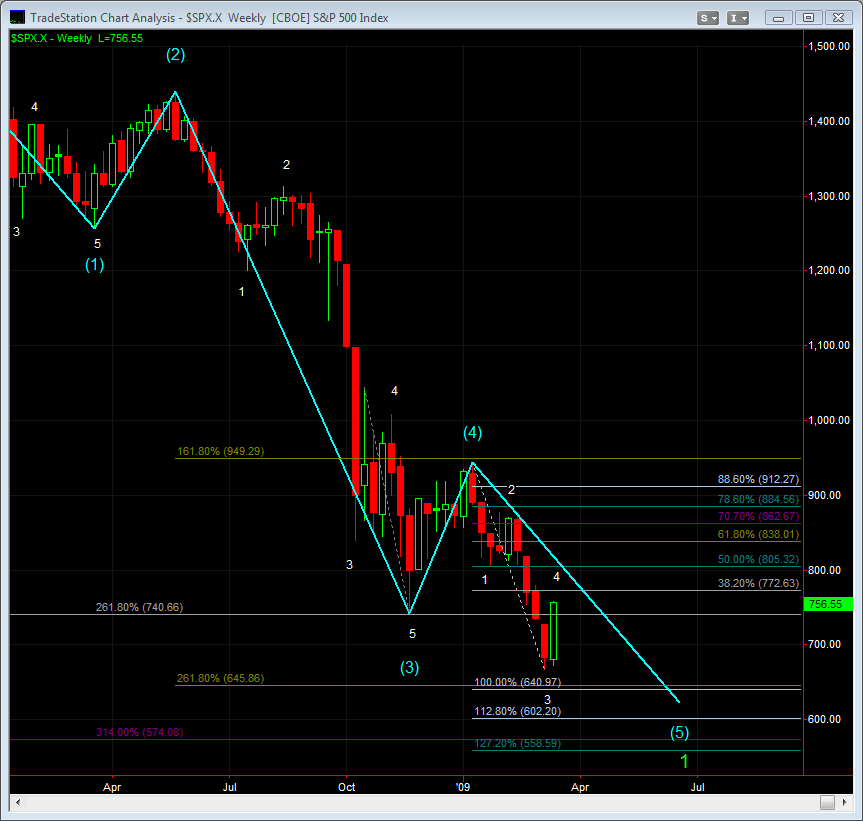
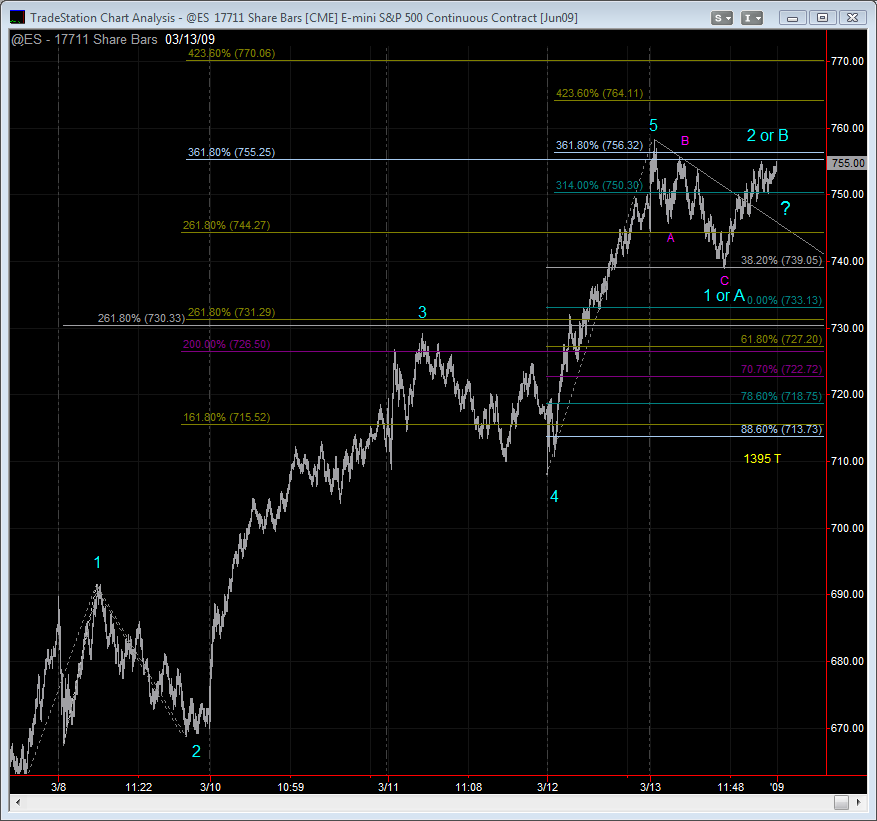
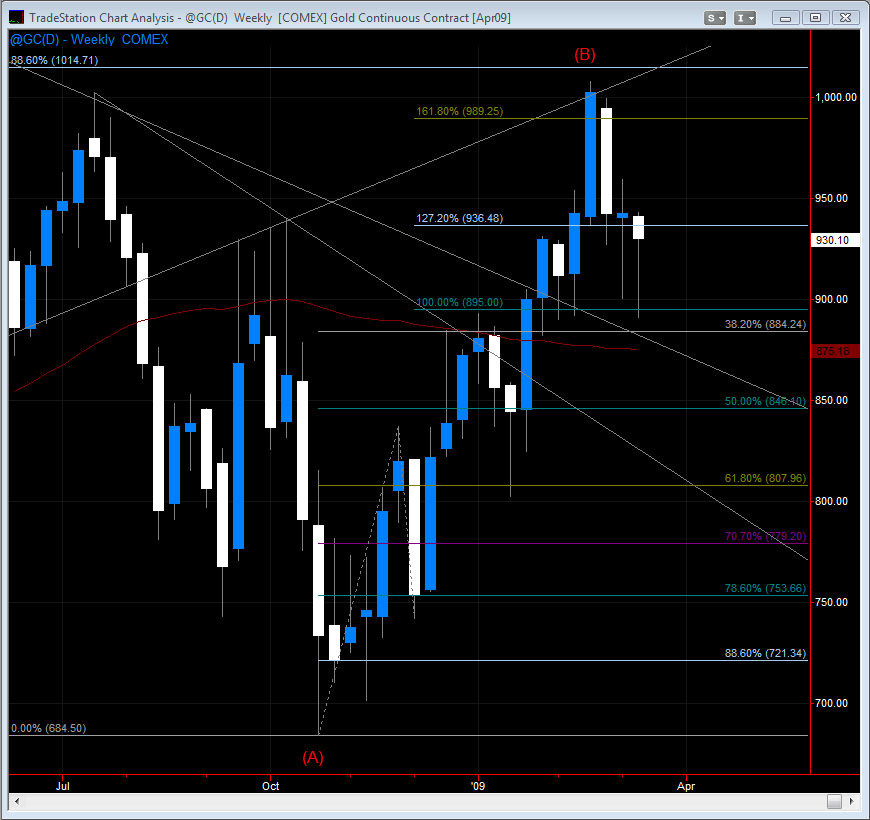
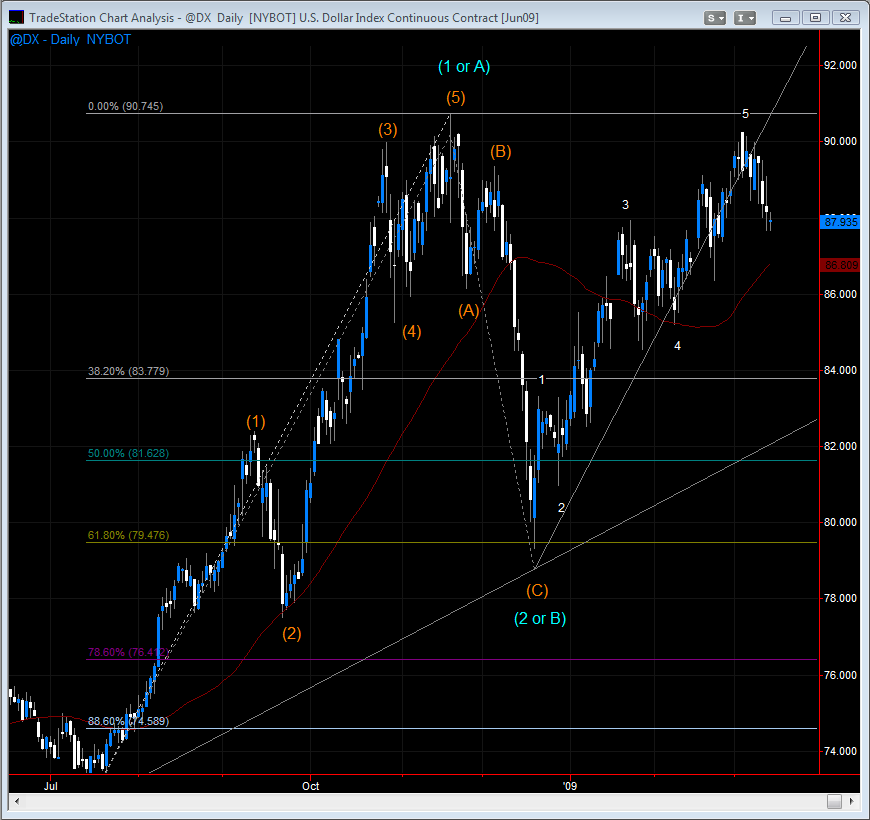
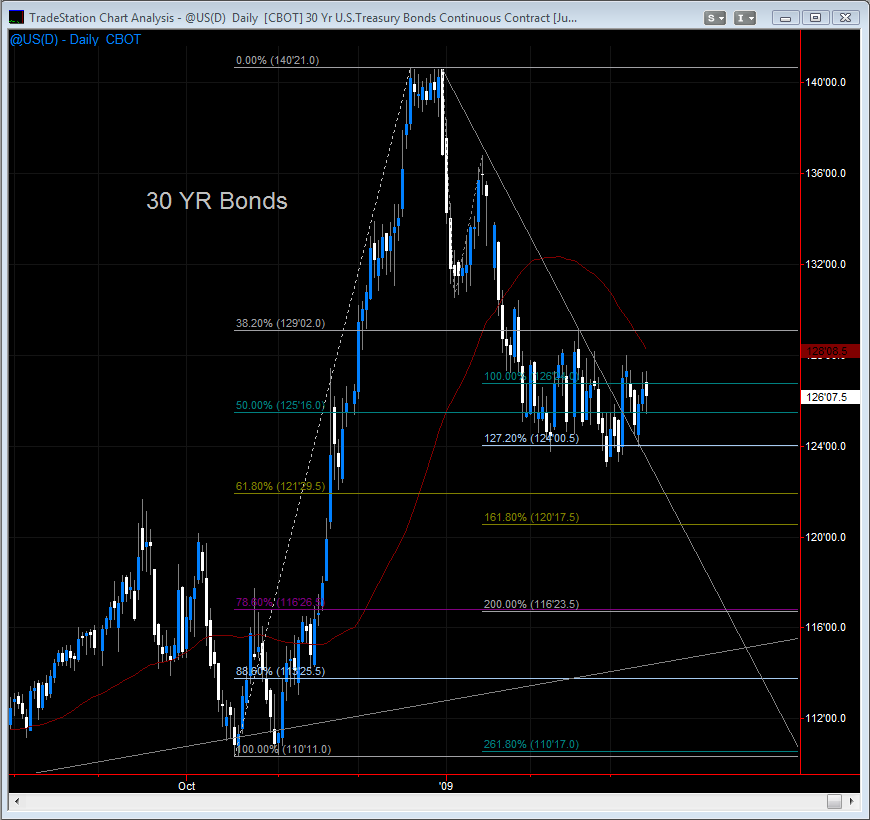
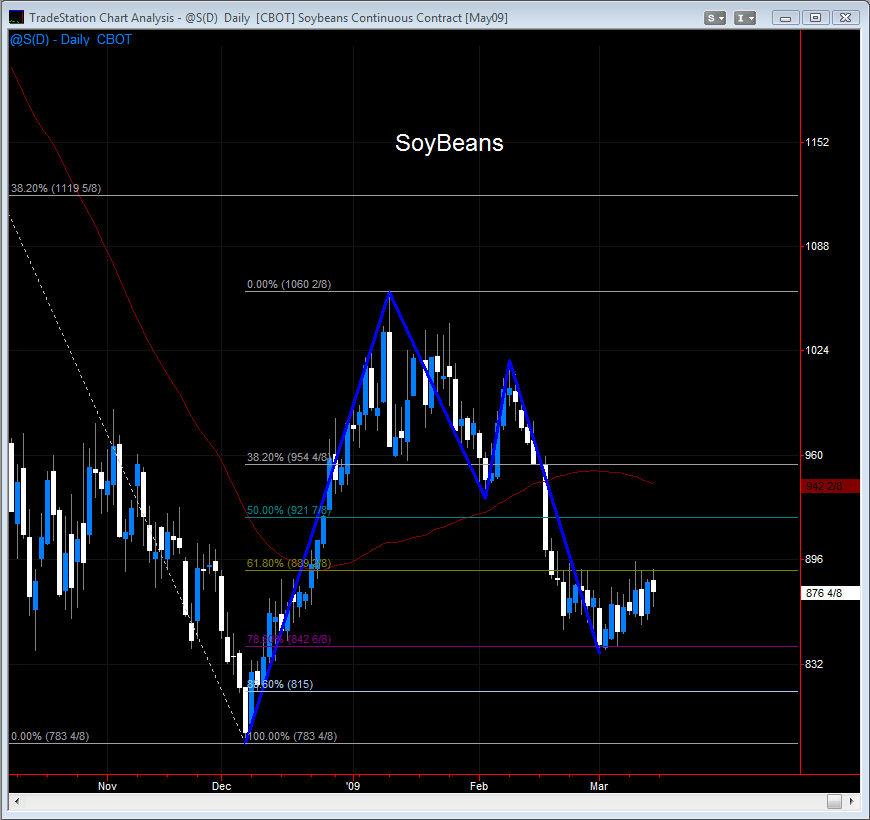
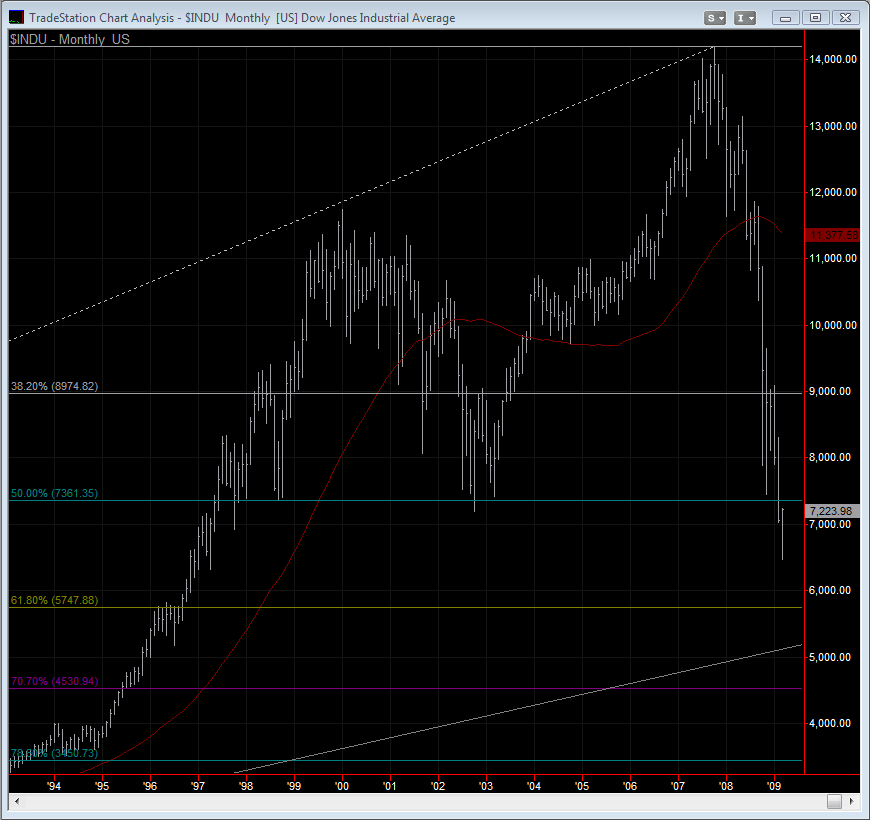
Weekend Chart Summary 3-14-09
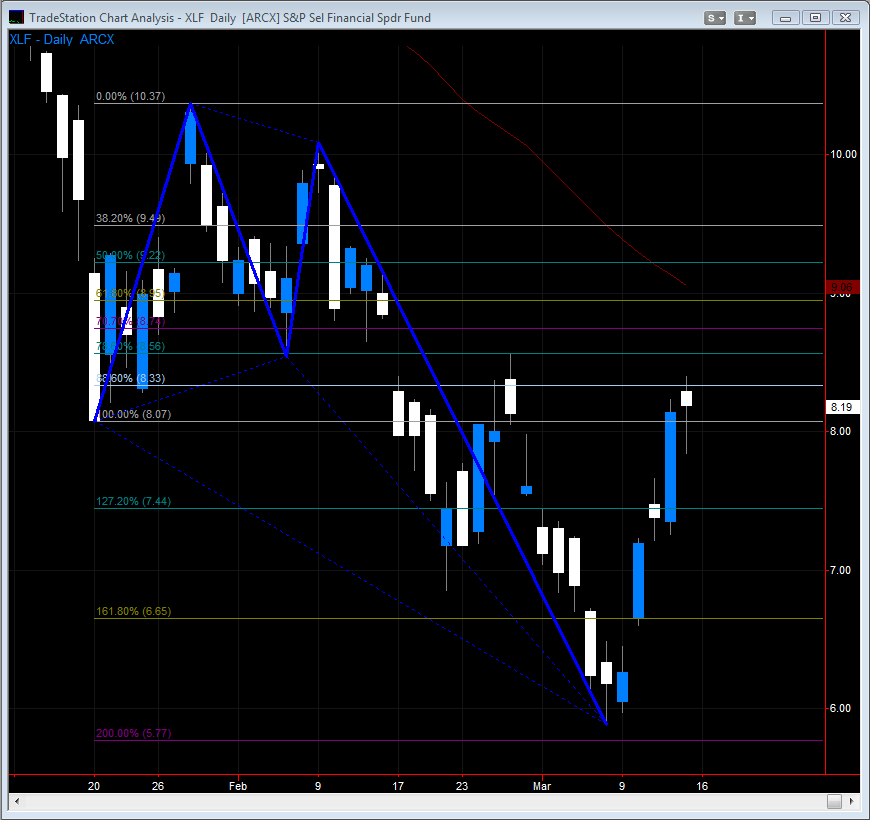
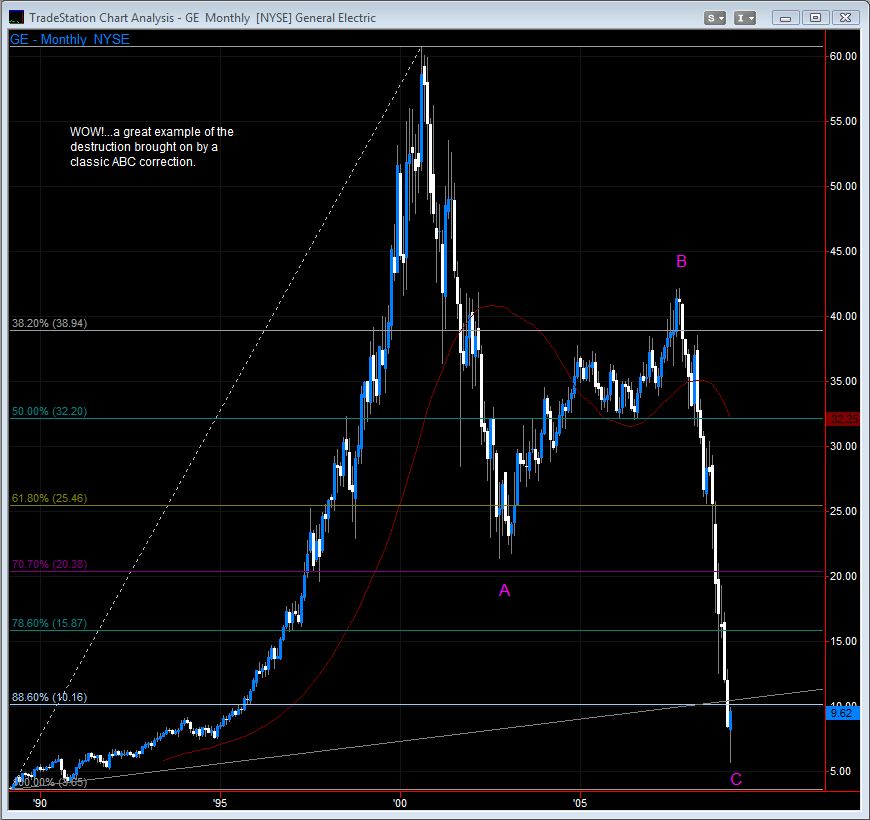
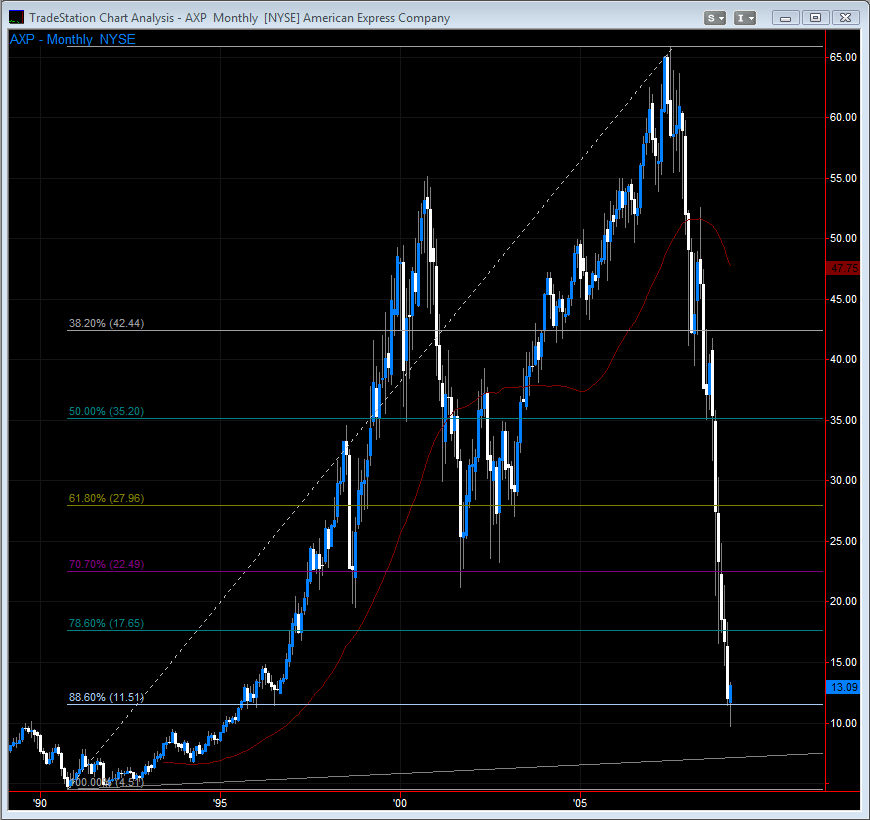
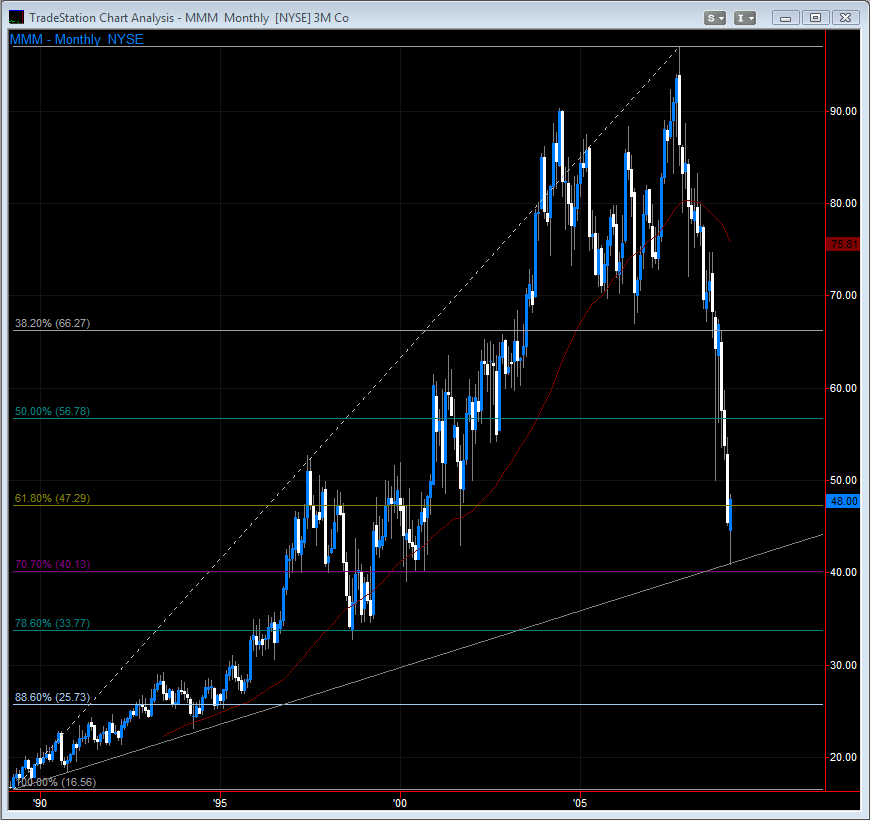
Click image for original size
Click image for original size
Click image for original size
Click image for original size
Click image for original size
Click image for original size

Click image for original size
Click image for original size
Click image for original size

Click image for original size
Click image for original size
Click image for original size

Click image for original size
Click image for original size
Click image for original size
Click image for original size
Click image for original size
Click image for original size
Click image for original size
Click image for original size

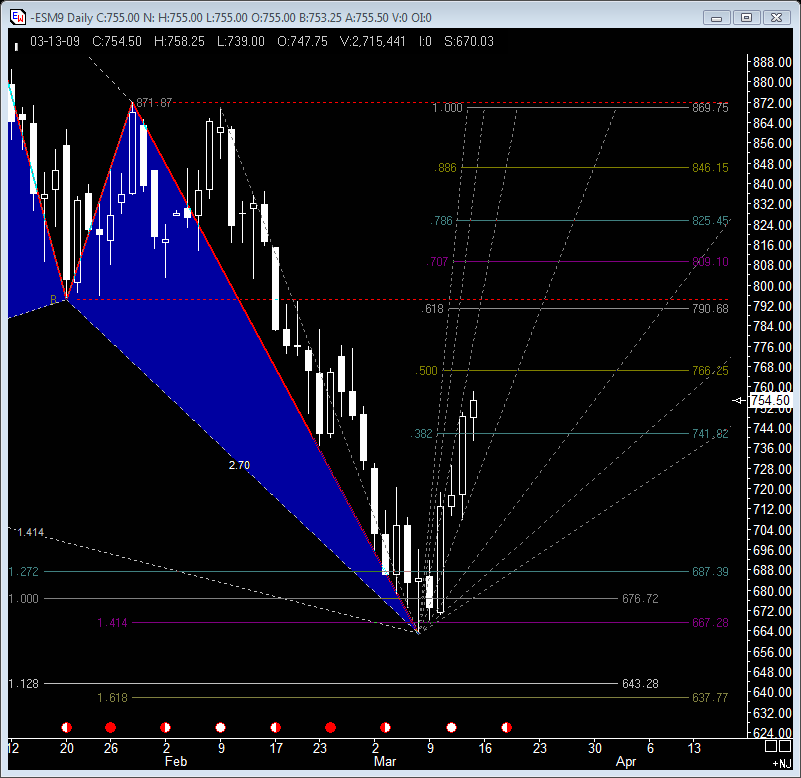
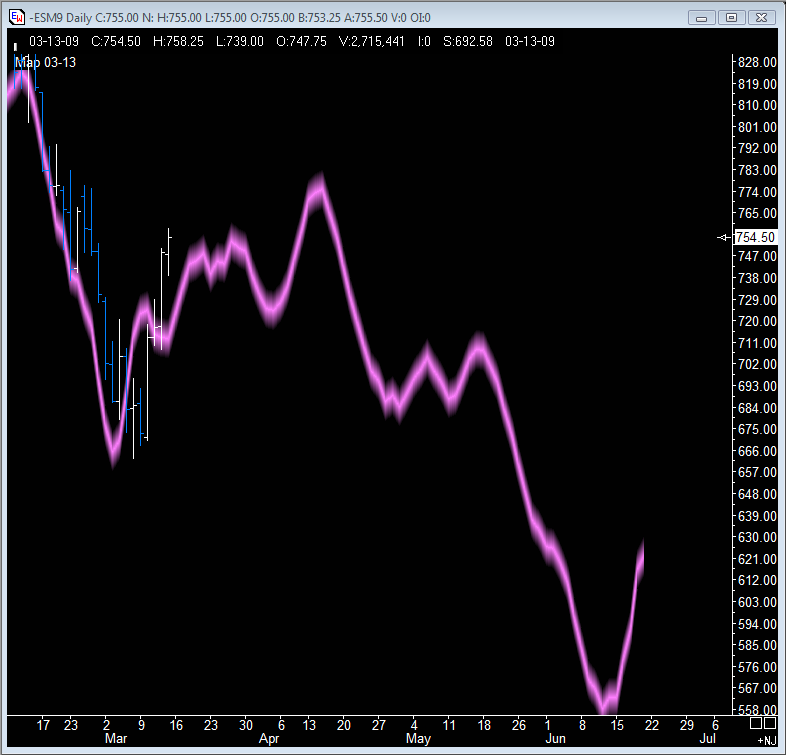
VO - What exactly is that first chart?????- what is that purple line projecting way out to June?
quote:
Originally posted by palmer
VO - What exactly is that first chart?????- what is that purple line projecting way out to June?
That is the Ensign map forecast applied to the daily chart.
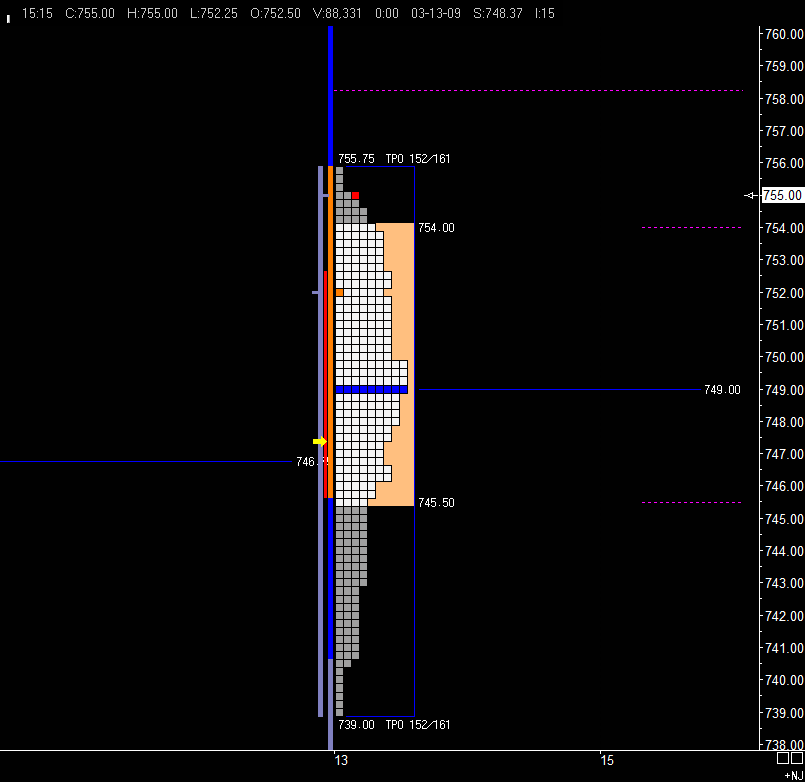
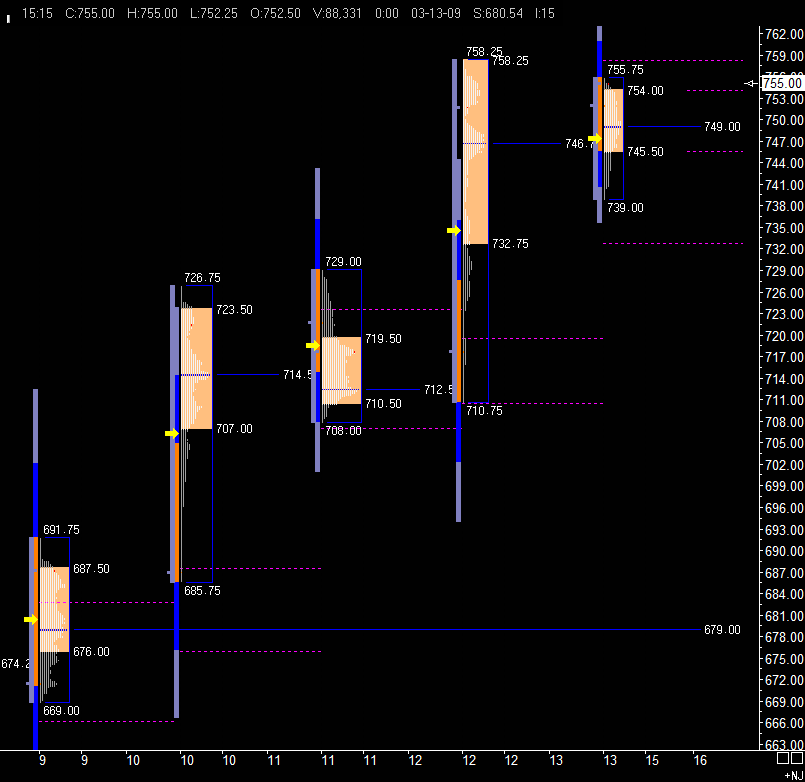
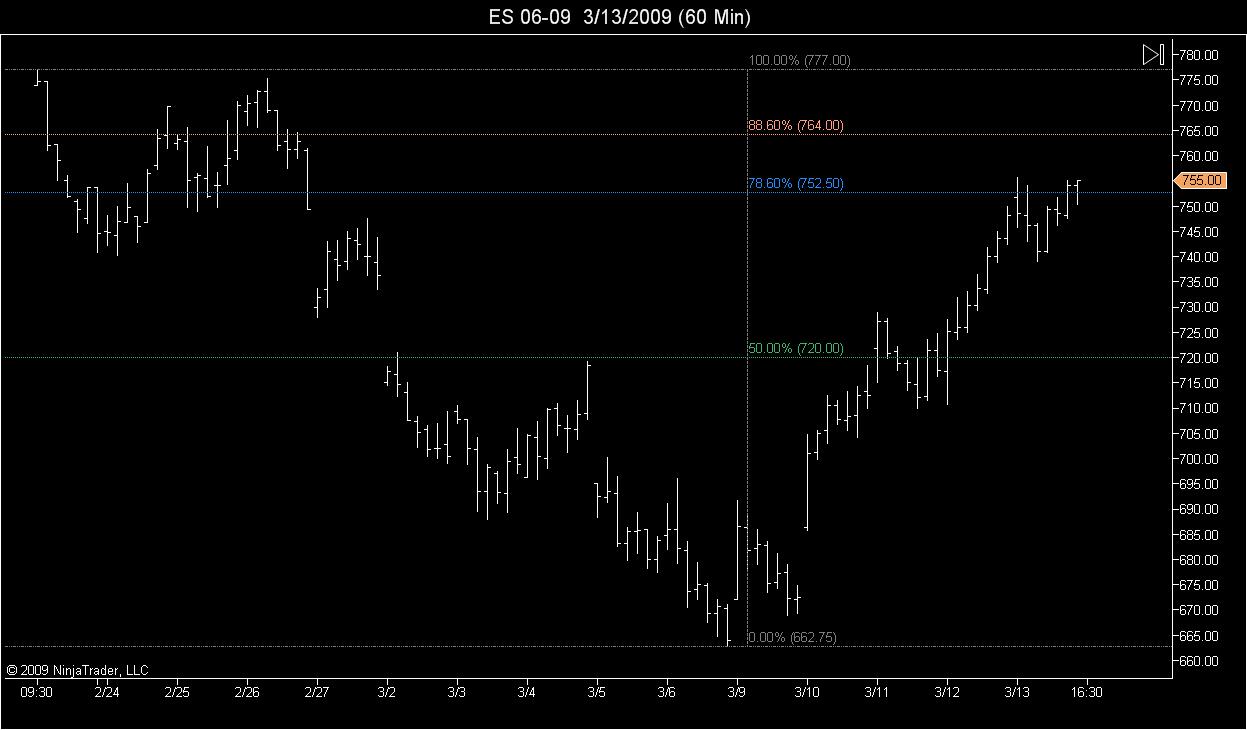
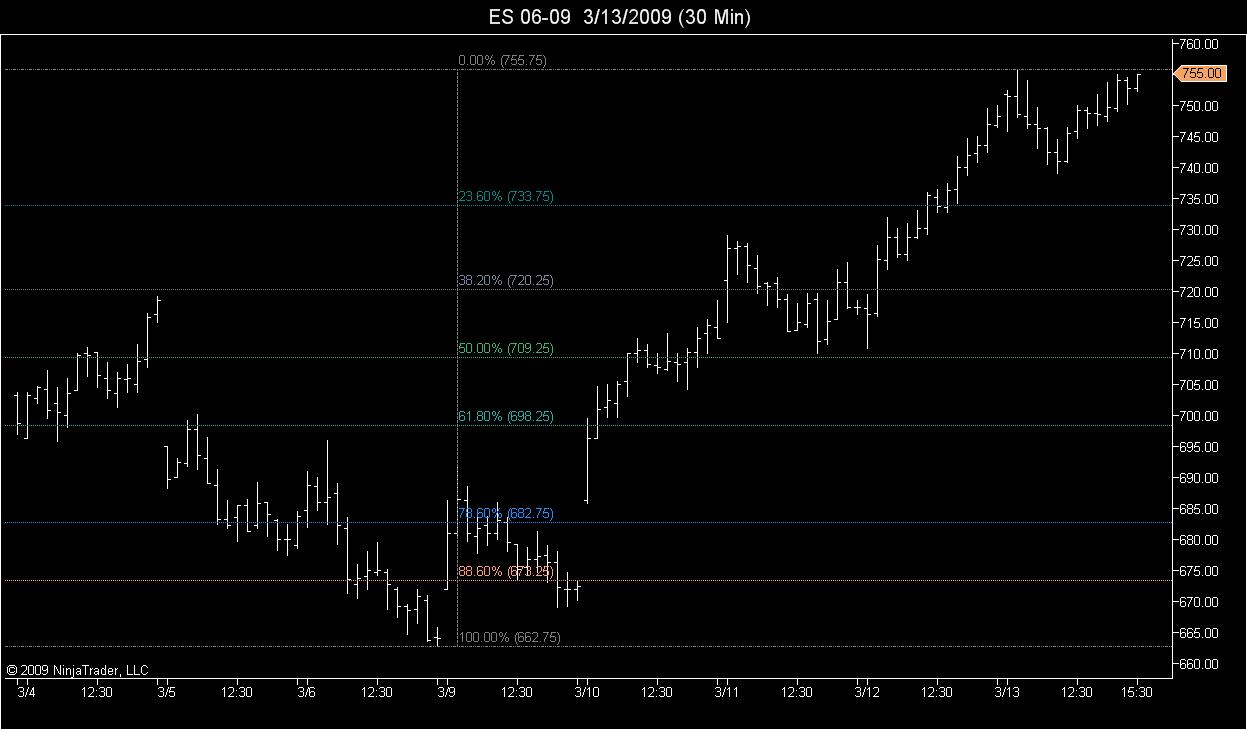
Weekly DeMark Pivot @ 737.75
High Ticks: 766.50 - 70.00 = 696.50
Friday was the narrowest range day in the past 21 trading days.
High Ticks: 766.50 - 70.00 = 696.50
Friday was the narrowest range day in the past 21 trading days.
Click image for original size
Click image for original size
Great charts and info. Thanks everyone!
AdvGet Weekly & 60 MIN
Click image for original size
Click image for original size
Jack,
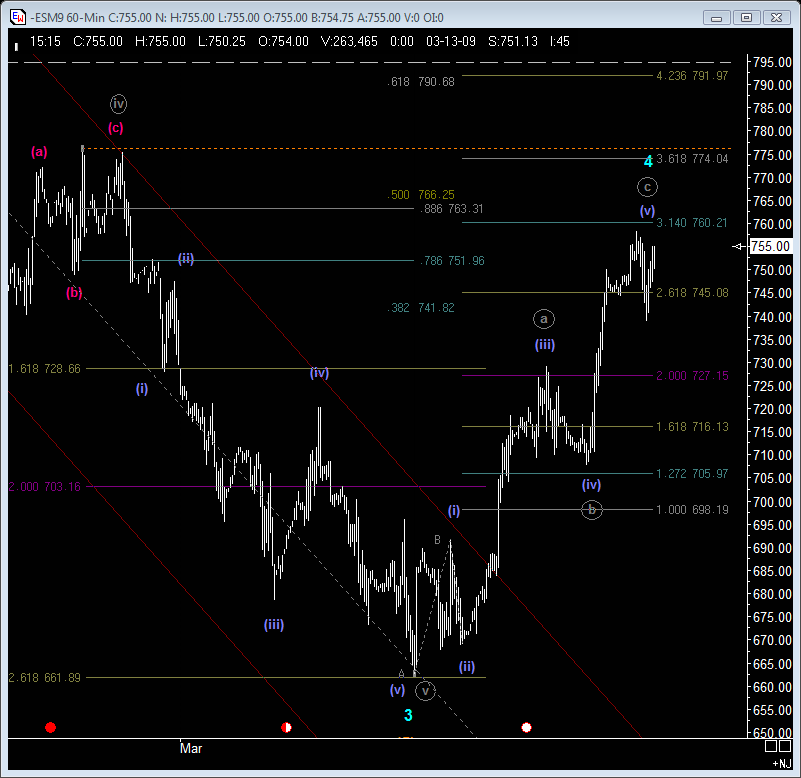
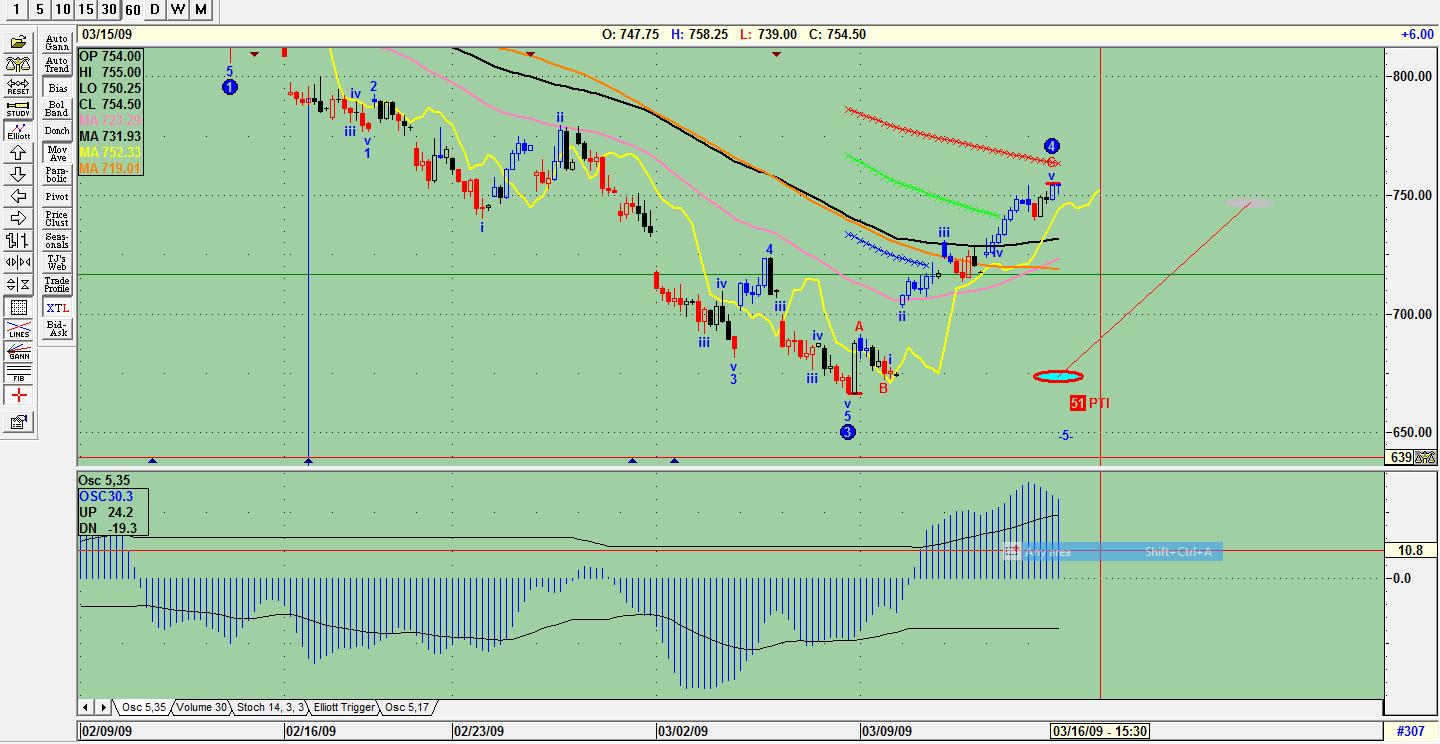
I am by no means an Elliot wave expert. But in that 60 min chart it had v, C, and 4 waves at Fridays high thats calling for a smaller ABC correction right?
I am by no means an Elliot wave expert. But in that 60 min chart it had v, C, and 4 waves at Fridays high thats calling for a smaller ABC correction right?
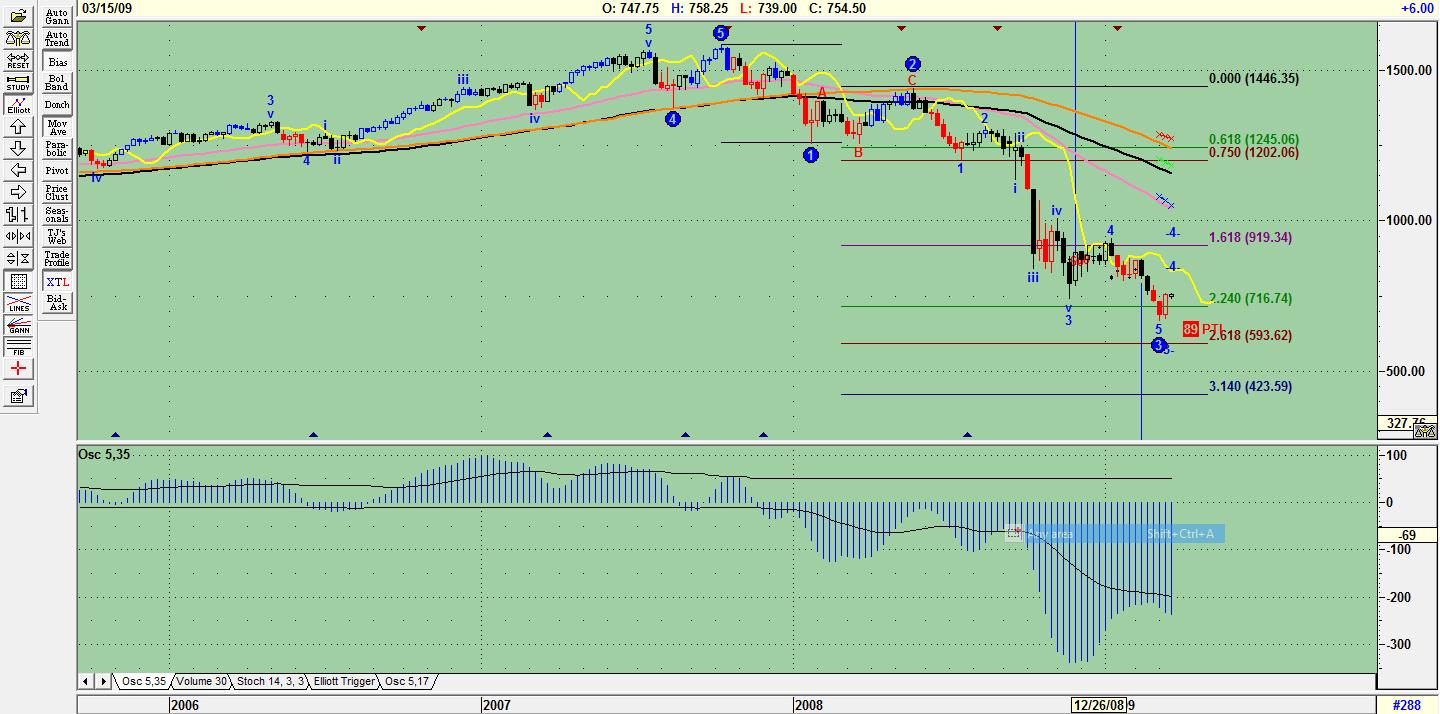
Joe, we are indeed in v of 4 and C. Jack uses pit session and can make it tuff to interpret (for instance it shows ii above i and we know that cant be the case). You can tell advget factors in the data not shown (I think). When those are complete we should begin 5 down. As a rule wave 4 never enters the price territory of wave 1. For the M contract wave 1's low is 794.75, which is denoted by a thick grey dashed line on my 60m chart. Also, a guideline (not rule) of a three wave correction (ABC) usually terminates within the price territory of the previous fourth wave of one lesser degree. Again for the M contract that high would be 775.25, which I have as a orange dotted line. So, bottom line is that we are very close (maybe there based on globex open) to starting our wave 5 down, which should take out the wave 3 low of 662.75 (M contract). 5th waves don't have to take out lows or highs...they can be truncated, but thats not the norm. I am no expert either Joe, however, I do have a working knowledge of Ewaves. I know your short from a previous post and you probably have nothing to worry about - is my qualified guess.
Jack what I find interesting in the weekly is that advget is hedging wave 4. I assume they changed this due to the strength of our last weekly candle. I have seen this from several other sources. It would be a shame if indeed we are still in a big ol' complex wave 4 correction. I would just assume we get on with 5 and make some hellish lows to scare the bejesus out of everyone and then we can have a layup rally. Sigh...if only it were that easy. Jack as always I appreciate you sharing the charts.
Emini Day Trading /
Daily Notes /
Forecast /
Economic Events /
Search /
Terms and Conditions /
Disclaimer /
Books /
Online Books /
Site Map /
Contact /
Privacy Policy /
Links /
About /
Day Trading Forum /
Investment Calculators /
Pivot Point Calculator /
Market Profile Generator /
Fibonacci Calculator /
Mailing List /
Advertise Here /
Articles /
Financial Terms /
Brokers /
Software /
Holidays /
Stock Split Calendar /
Mortgage Calculator /
Donate
Copyright © 2004-2023, MyPivots. All rights reserved.
Copyright © 2004-2023, MyPivots. All rights reserved.