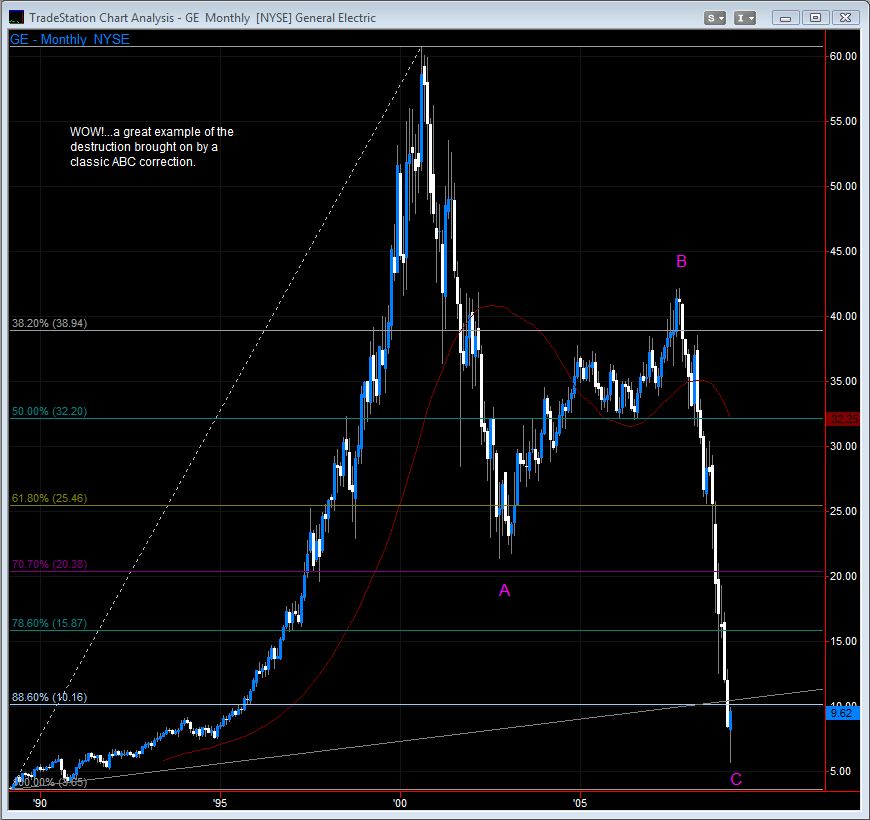
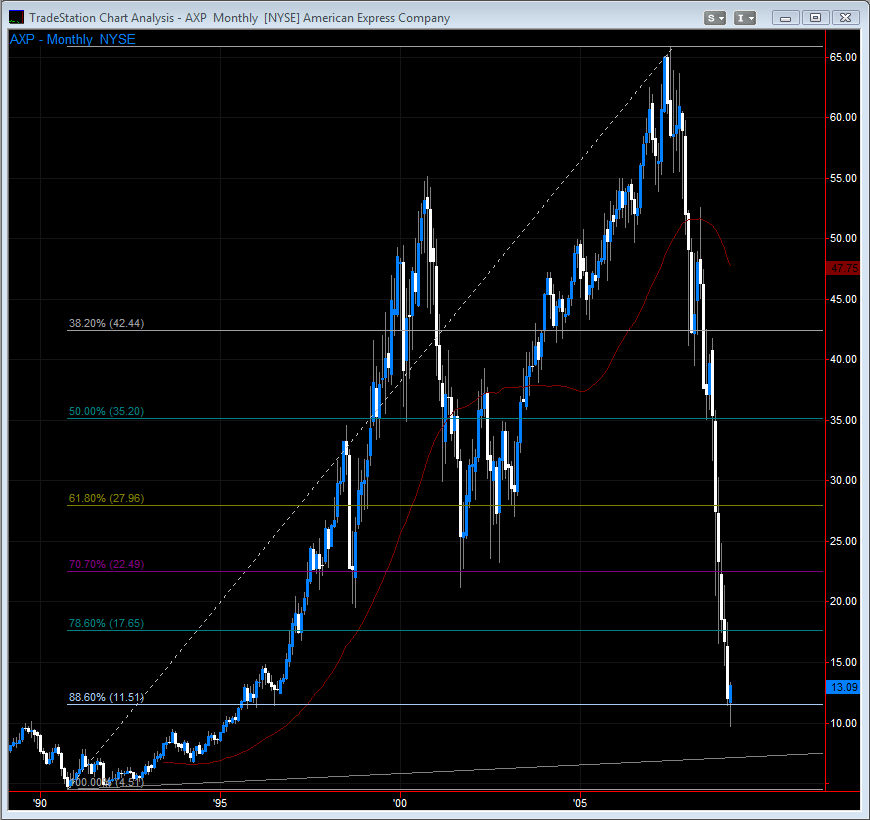
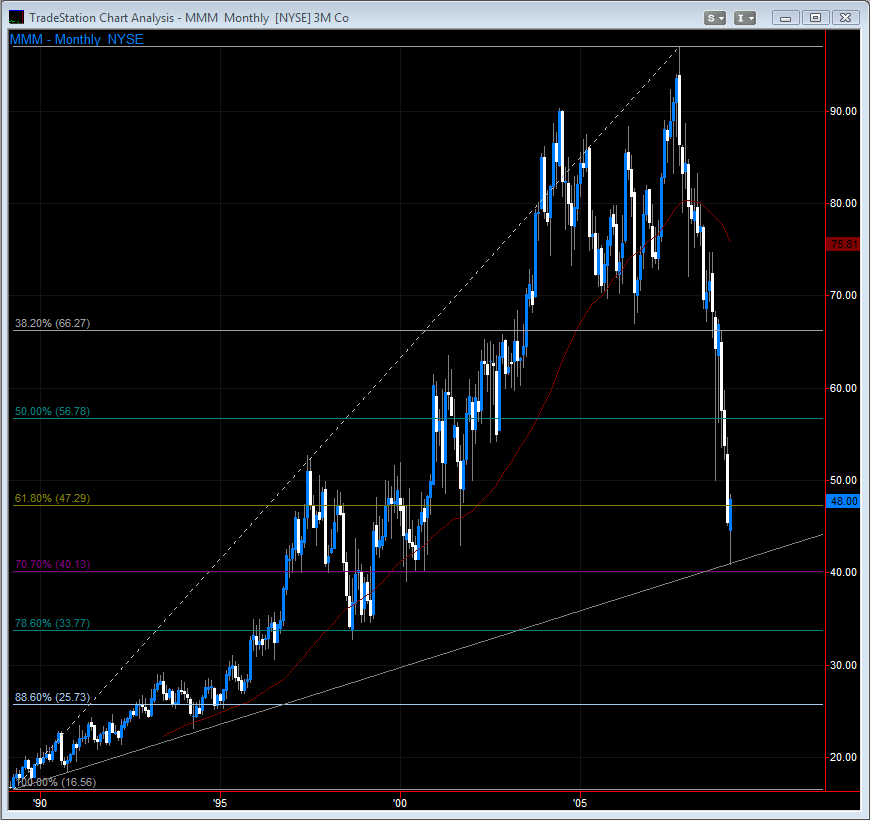
Weekend Chart Summary 3-14-09
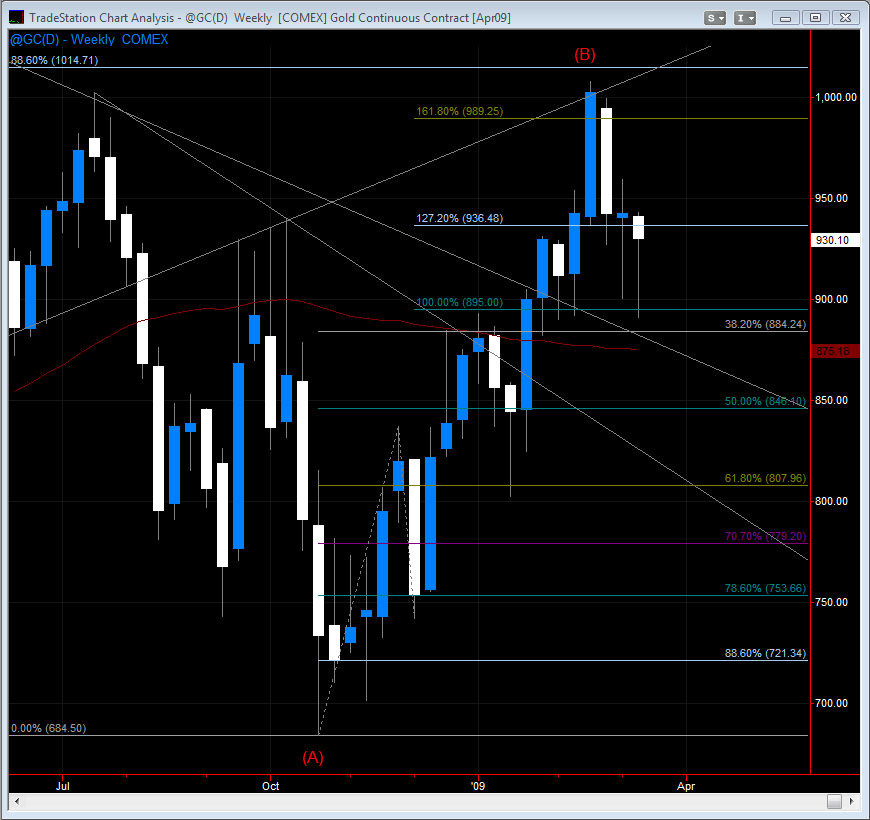
Click image for original size
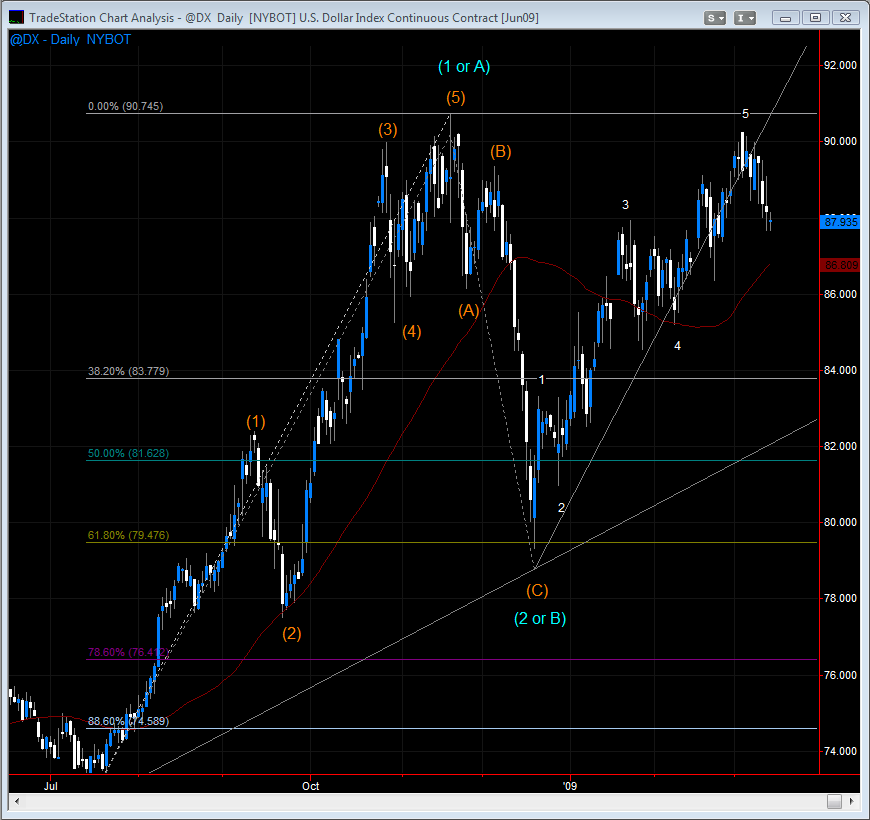
Click image for original size
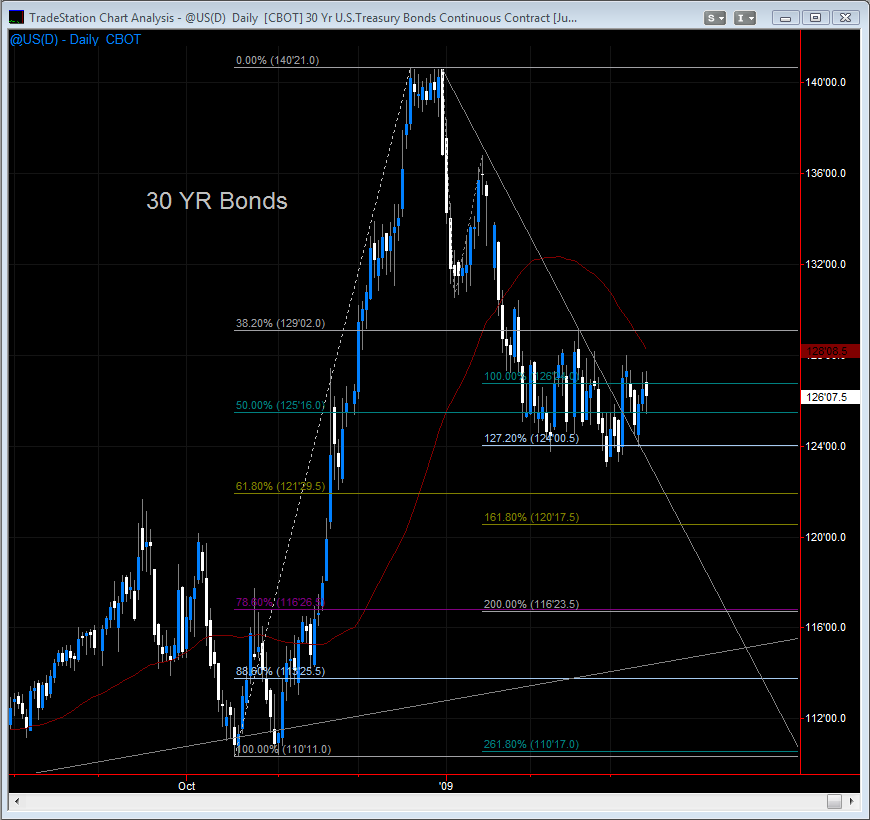
Click image for original size
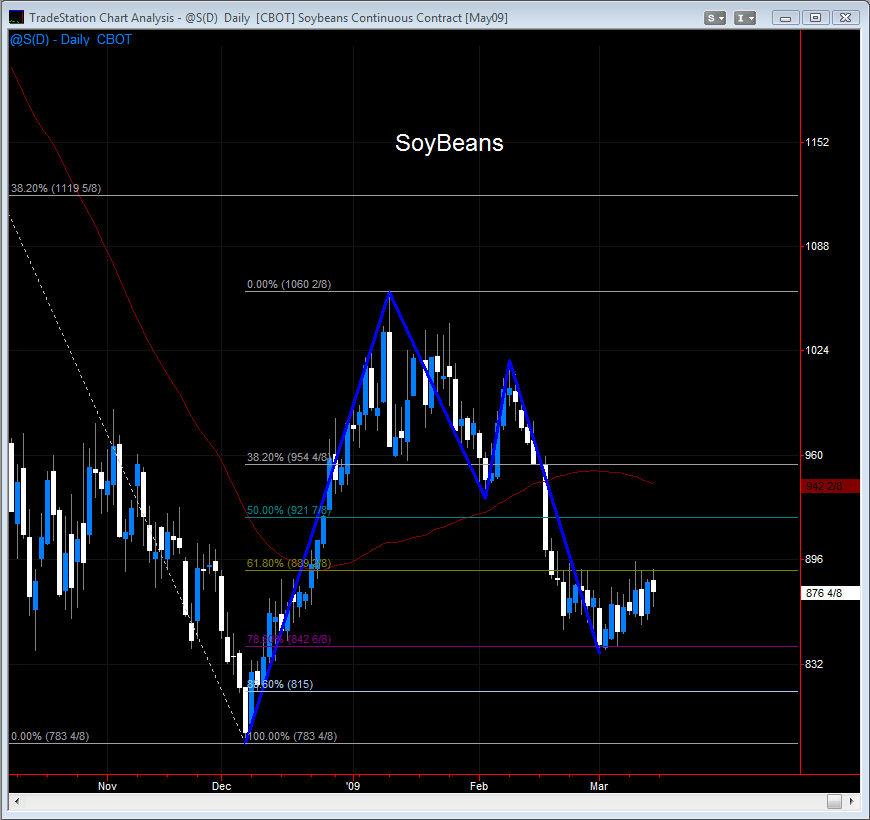
Click image for original size
Click image for original size
Click image for original size

Click image for original size
Click image for original size
Click image for original size

Click image for original size
Click image for original size
Click image for original size

Click image for original size
Click image for original size
Click image for original size
Click image for original size
Click image for original size
Click image for original size
VO- What is that red swirly line on some of you charts??? (wheat and 30yr)
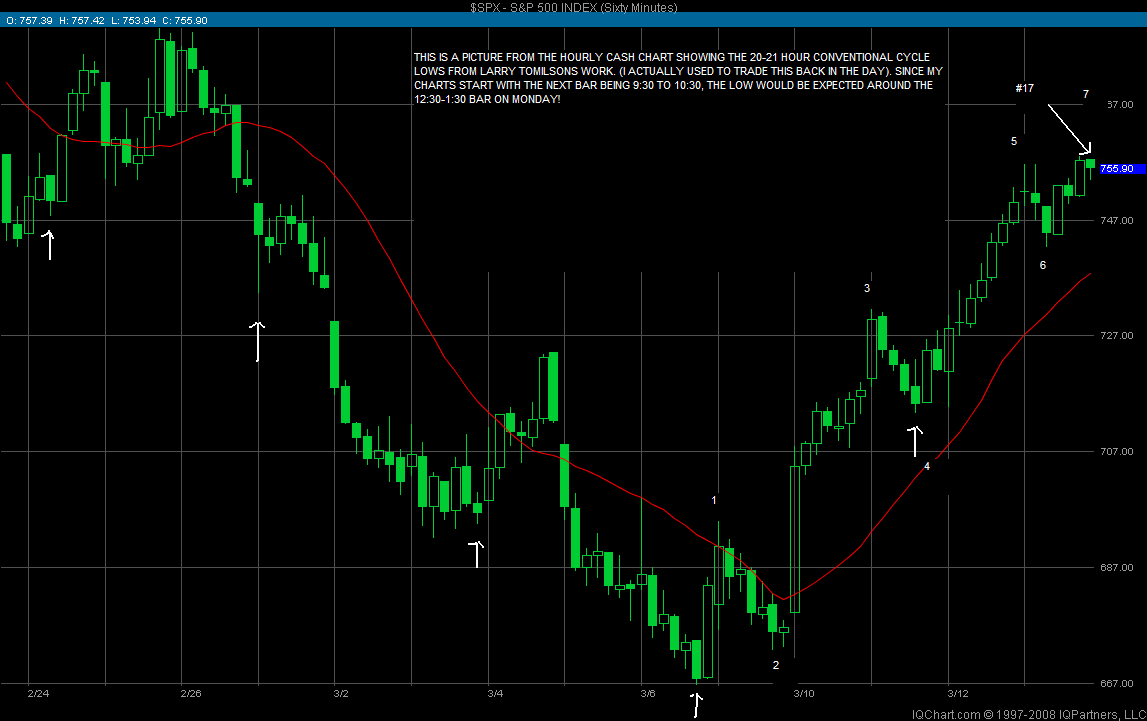
Kool- Are you showing two non related analysis to both charts. The first chart are you saying the 12:30-1:30 lows for Monday corresponds to the chart two analysis of a top and thus a pullback? Are you saying the pullback will just be till 1:30.
After friday's tick reading of 648, coupled with tuesday's 1602 and thursday's 1237, seem like we should see a significant decline next week especially with option expiration I wouldn't be surprised. The internal already look overbought but that doesn't mean we can't stay overbought
After friday's tick reading of 648, coupled with tuesday's 1602 and thursday's 1237, seem like we should see a significant decline next week especially with option expiration I wouldn't be surprised. The internal already look overbought but that doesn't mean we can't stay overbought
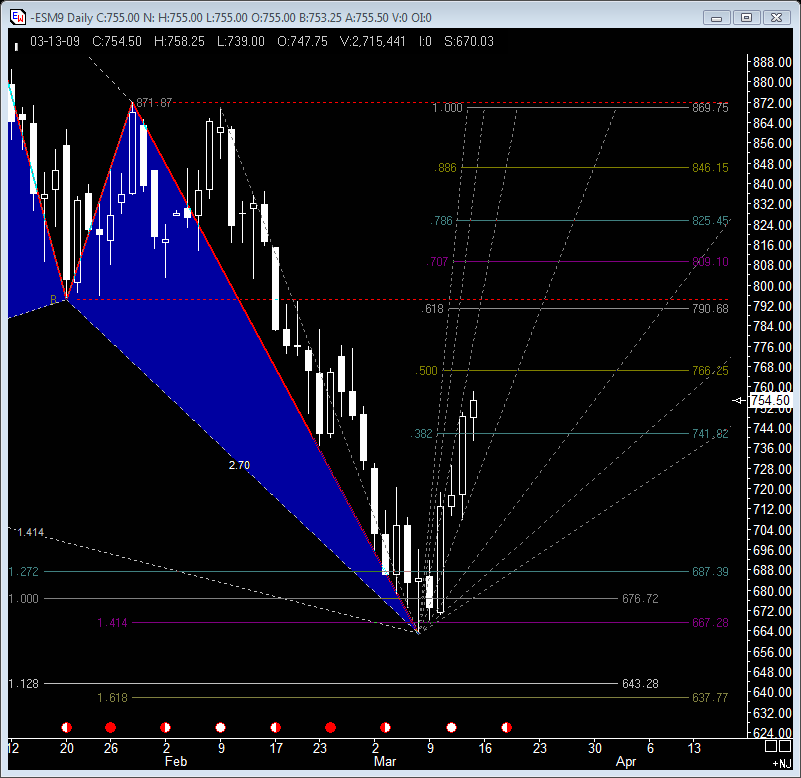
Note on the 'cash' chart the ever important 'boll.' avg (15 period e.m.a.) is around 736. the daily shows its avg at 733 and the hourly es chart has its 'regular' avg (54 period e.m.a.) at 736. On an hourly basis, this avg has contained the entire move up, except for being pierced once by 6 ticks followed by a quick rebound up above it again. This points out the importance in my mind of the 730 level as being critical for the bullish cause! We'll need to keep an eye on this mon. as any move into the 720's could be signalling something bigger happening on the downside!
Click image for original size

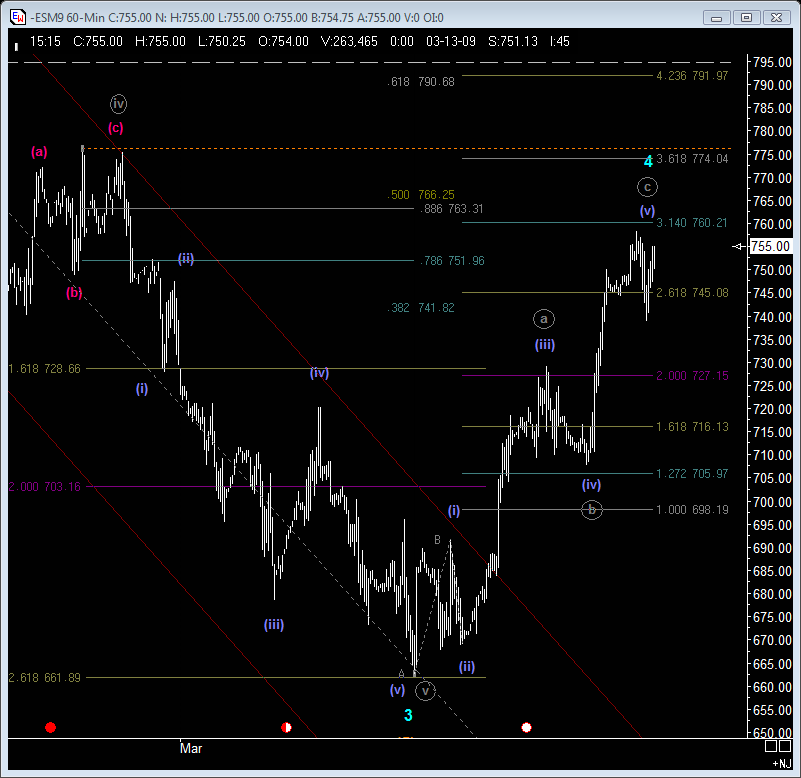
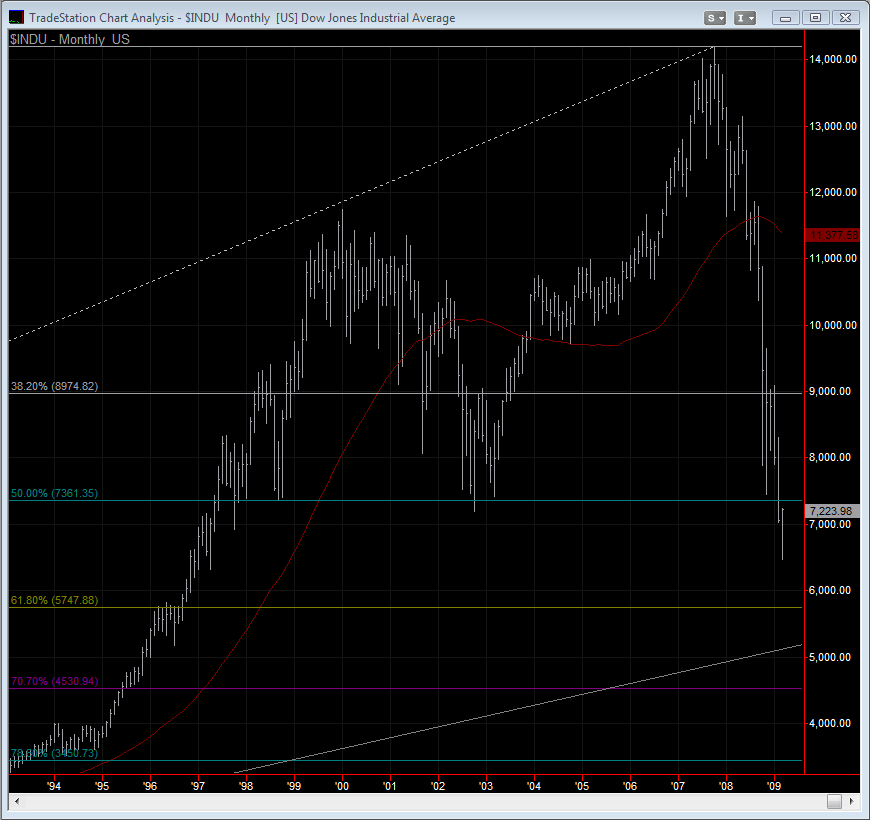
quote:Palmer... unrelated? they both seem to be supportive of each other in my mind. And that is that there is a real possibility of a short term top either in or coming real soon! As far as the 'conventional' cycle low mon is concerned, i make no predictions as to how low we go... i let the market tell me what it wants to do thru price projection and my own cycles. You should know that. I simply wanted to point out the importance of this 730 area IF a decline has begun or is soon upon us.As to closing ticks, that would seem to reinforce the notion that the bulls may be on borrowed time as you point out! Incidently, another interesting thing to take away from the daily chart posted. See the pierce of the white avg(54) back in early Jan? that avg has contained the decline ever since the may high around 1440. Your first clue that a monster rally is underway or the bear is over would be a upward pierce of that avg for more than 2 or 3 days that holds above it. I doubt that we see that now, but i suppose anything is possible.
Originally posted by palmer
Kool- Are you showing two non related analysis to both charts. The first chart are you saying the 12:30-1:30 lows for Monday corresponds to the chart two analysis of a top and thus a pullback? Are you saying the pullback will just be till 1:30.
After friday's tick reading of 648, coupled with tuesday's 1602 and thursday's 1237, seem like we should see a significant decline next week especially with option expiration I wouldn't be surprised. The internal already look overbought but that doesn't mean we can't stay overbought
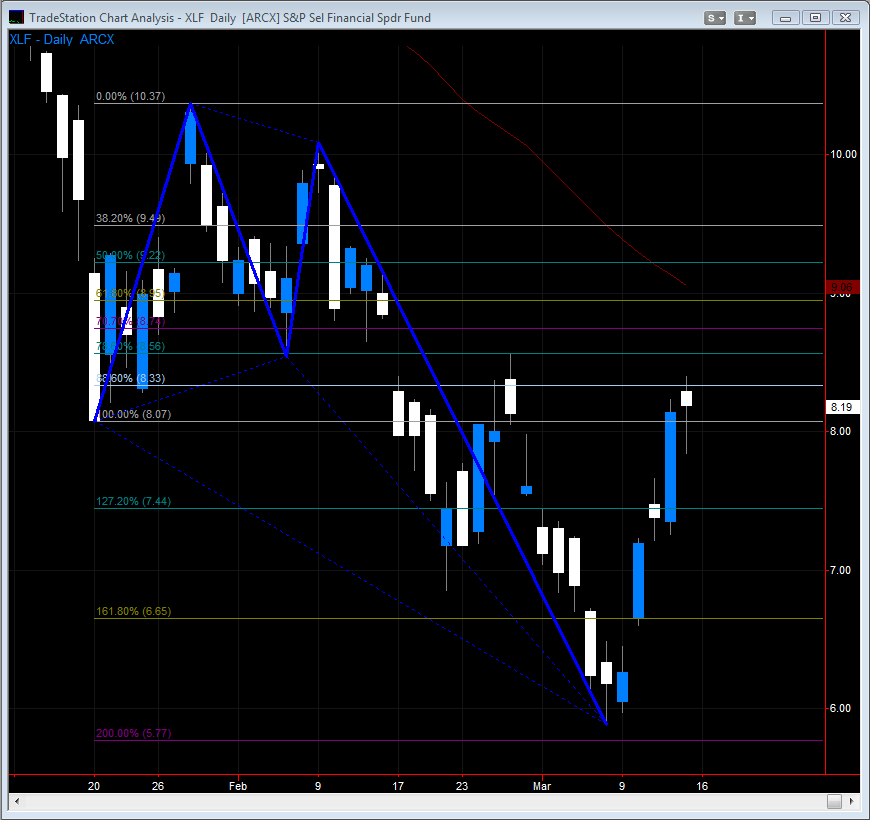
Thanks Kool- that was my real question of how low do you think we will go. For me and maybe VO or PT can look at this but I am taking this as a ABC correction off the lows. I think we are in A and B should be our little pullback which should happen soon based on the ticks, then we get a C up again.
Click image for original size
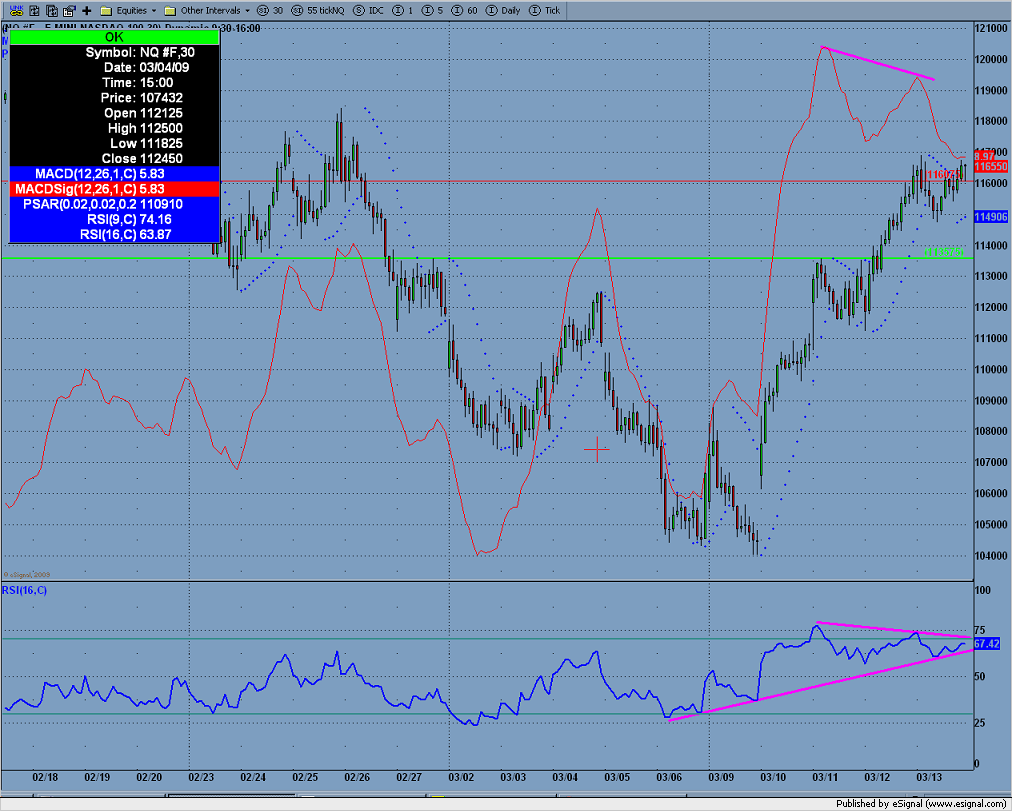
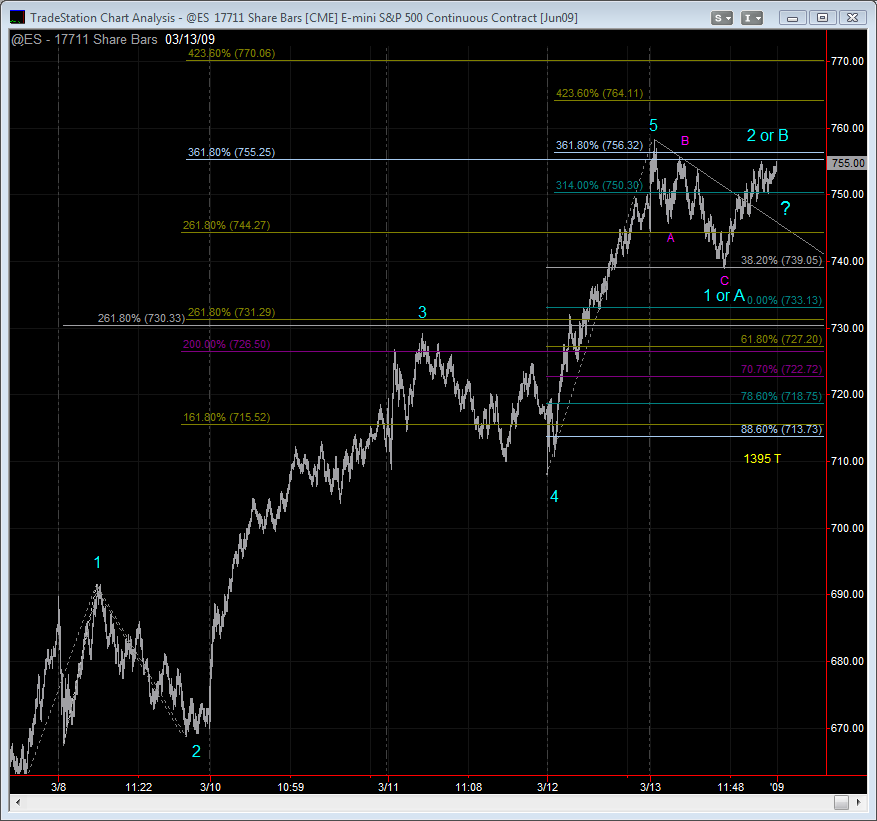
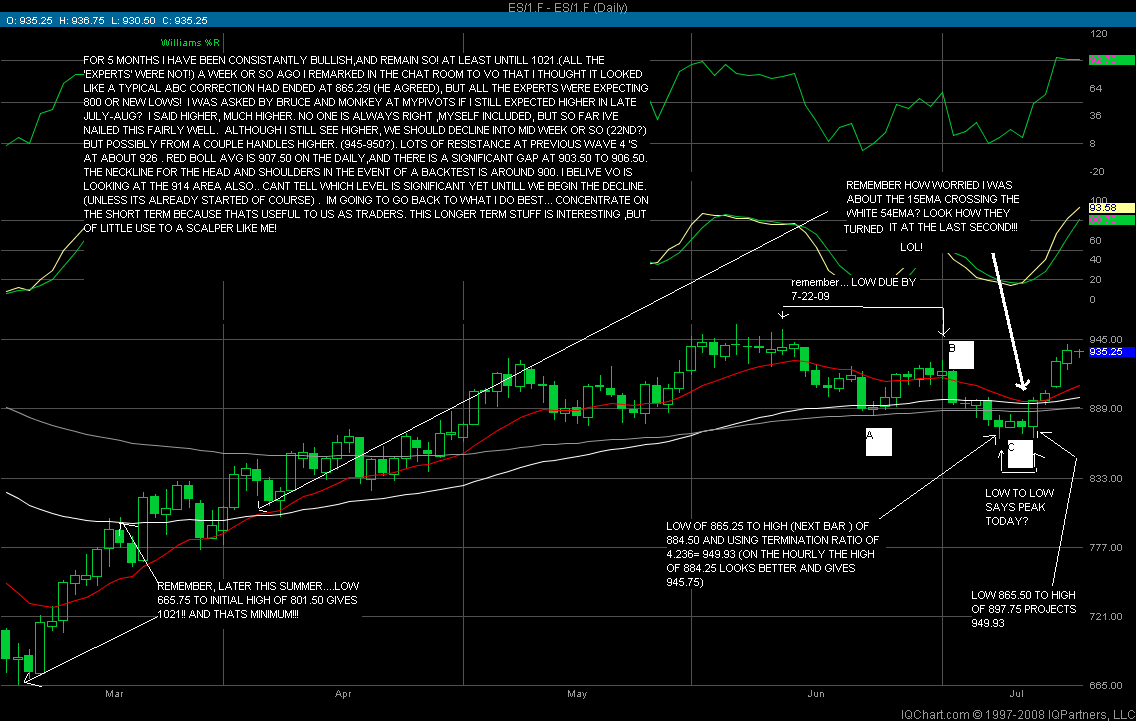
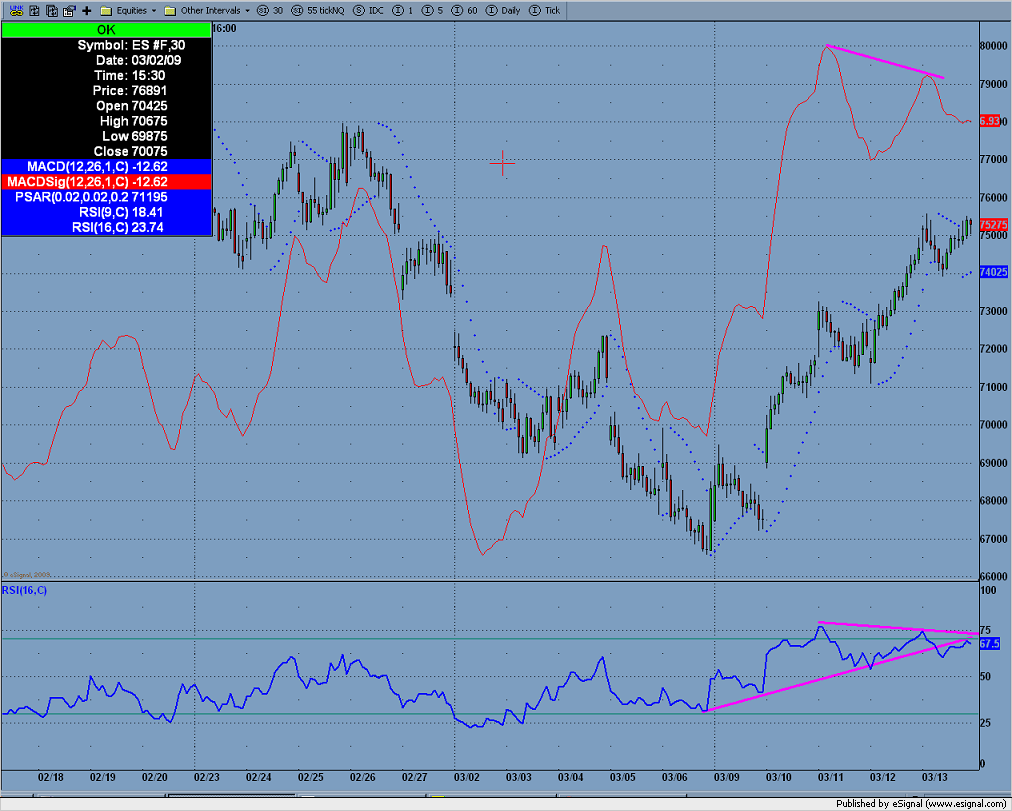
Here is a chart on the NQ. I am showing 2 major divergence in the RSI, and my MACD. The same on the S&P, looks at lest short term we have already or very close to a near term top. We have not had 2 back to back gaining weeks in the ES since 8/11/2008 and we just got slammed after that. IMHO I don't think 1040 on the NQ and 665.75 on the ES was "THE low" I am heavy short in the ES and Daq...looking for the ES to at least hit 730 level.
Click image for original size
quote:
Originally posted by palmer
VO- What is that red swirly line on some of you charts??? (wheat and 30yr)
50 sma
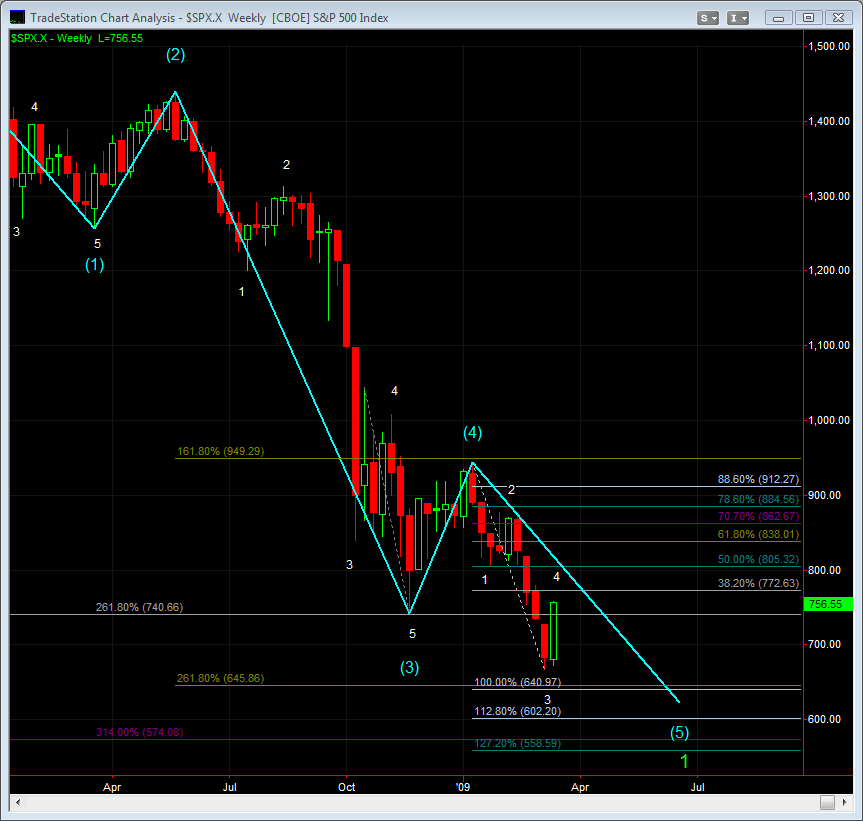
Jack what I find interesting in the weekly is that advget is hedging wave 4. I assume they changed this due to the strength of our last weekly candle. I have seen this from several other sources. It would be a shame if indeed we are still in a big ol' complex wave 4 correction. I would just assume we get on with 5 and make some hellish lows to scare the bejesus out of everyone and then we can have a layup rally. Sigh...if only it were that easy. Jack as always I appreciate you sharing the charts.
Emini Day Trading /
Daily Notes /
Forecast /
Economic Events /
Search /
Terms and Conditions /
Disclaimer /
Books /
Online Books /
Site Map /
Contact /
Privacy Policy /
Links /
About /
Day Trading Forum /
Investment Calculators /
Pivot Point Calculator /
Market Profile Generator /
Fibonacci Calculator /
Mailing List /
Advertise Here /
Articles /
Financial Terms /
Brokers /
Software /
Holidays /
Stock Split Calendar /
Mortgage Calculator /
Donate
Copyright © 2004-2023, MyPivots. All rights reserved.
Copyright © 2004-2023, MyPivots. All rights reserved.