$VOLD
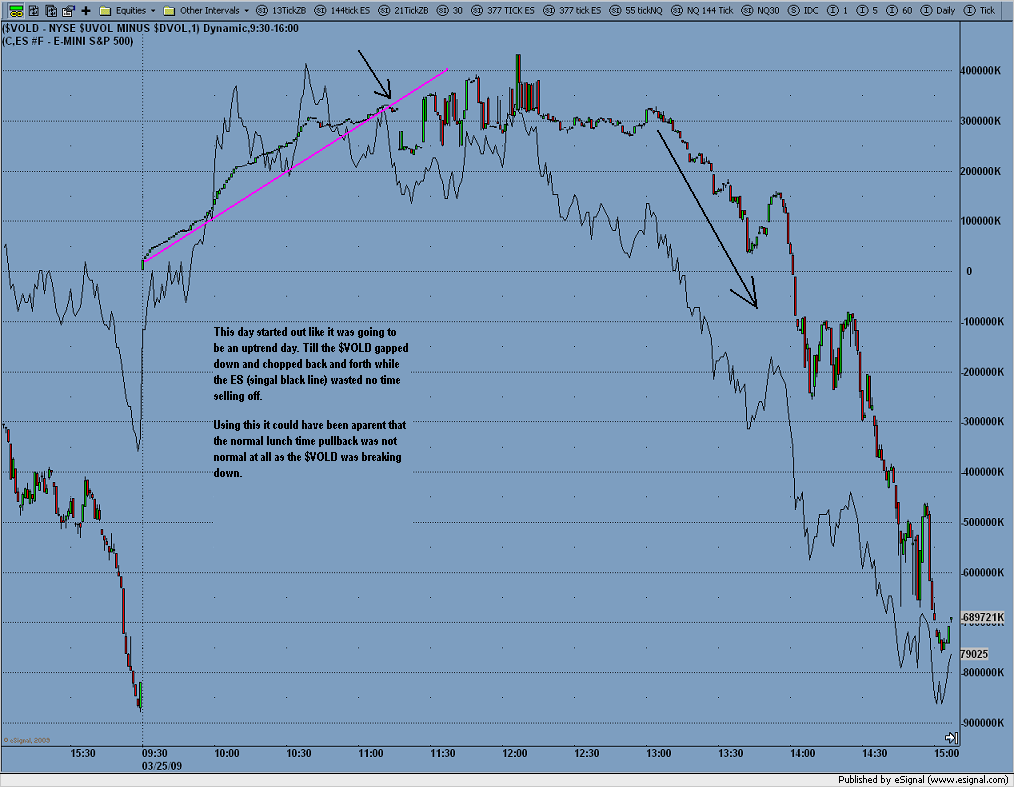
This is the NYSE up volume minus the down volume.
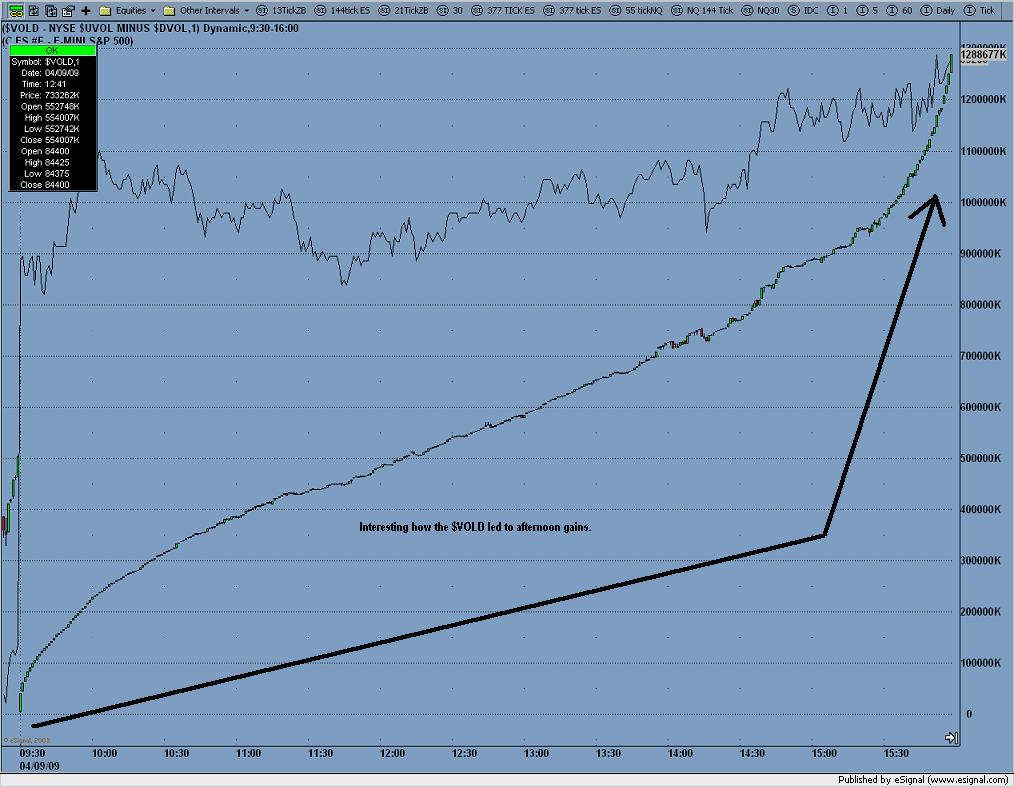
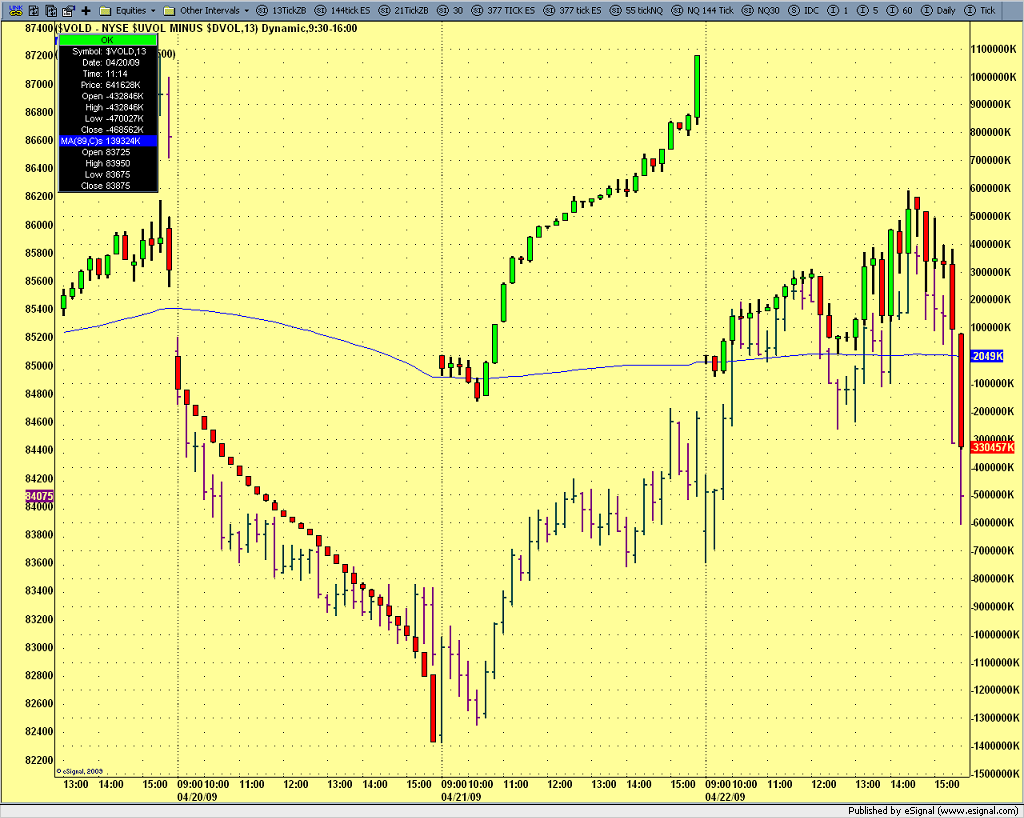
Something very interesting about this $vold, this is what trend days look like. That is very very few bars crossing the previous bars hi/lo. You can spot a trend day VERY quick with this.
The last chart is typical trend day indicator according to what I am seeing.
Something very interesting about this $vold, this is what trend days look like. That is very very few bars crossing the previous bars hi/lo. You can spot a trend day VERY quick with this.
Click image for original size
Click image for original size
The last chart is typical trend day indicator according to what I am seeing.
Click image for original size
This is all after the fact, and hind sight is alway perfect I am going to have to watch it intra-day but just spotting the trend days alone is like picking up money on the street.
Click image for original size
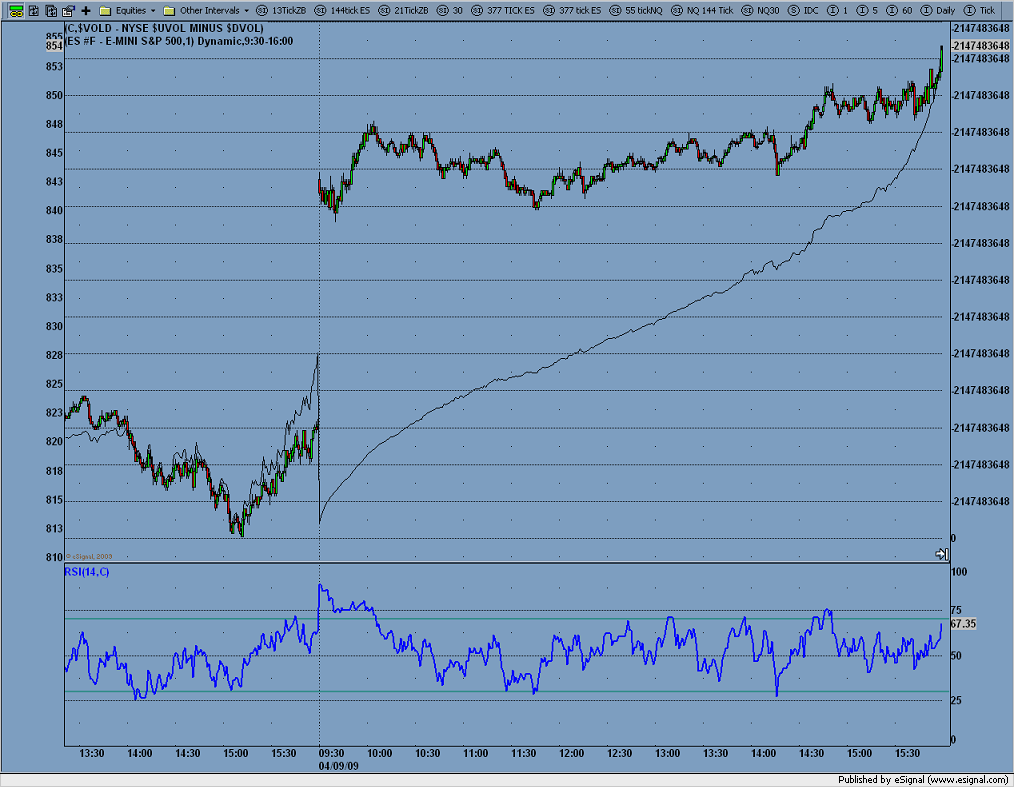
I switched the ES and $VOLD around, the ES is now the candle and the $VOLD is now the singal line. Notice at around 11:30 when the ES was testing the lows the $VOLD was climing like a rocket and with RSI saying buy this was a great low risk trade, a good one to double up.
Hi Joe,
How do you add the ES on top of the $vold chart,looks like you are using E signal, and that is what I use, Thanks in advance for your input.
Printer
How do you add the ES on top of the $vold chart,looks like you are using E signal, and that is what I use, Thanks in advance for your input.
Printer
highlight a chart by clicking, then type 1, a window will pop up showing the symbol and time period then click on multiple symbols and add a symbol
Thanks for all the charts here and the other threads...glad you are enjoying the VOLD so far....here are some typed up notes I took while I was in the JPJ chat room...they call the Vold , the CHESTER.....( named after a woman who introduced them to the VOLD)
"Chester - 89 ema on 13 minute..is like a line in the sand ..it will be support or resistence….
vold is the up and down volume of the stocks trading on the nyse. So yesterdays volume is going to have an impact on todays action
she will use divergence on the 60 minute chester for longer term view
wait for chester to open and see which way it is traveloing
200 k on the plus side then stay long…..200 minus stay short but if it gets to 400 look to reversal or correction or a minor stop for a trending day…
so the levels are +-200k (range) greater than +-400k trend
She uses one minute at the open to see if she wants in…she looks where is the 89 ema from the 3 minute and 60 minute and one minute…how is it traveking from the one to the 3 minute to the 13…
Signal is only true way to get chester due to data..
study 60 minute for divergences on chester..she watch the 1, 13 ,13 and 60 minute for support and resitence …doesn’t suggest crossovers..
areas to watch on chester are 200, 400 and 800,
(11:33 AM) seeno73: ty rob
(11:33 AM) ROBAIM: 400 is my preference, fwiw
(11:33 AM) seeno73: ok
(11:33 AM) Darren08: anyone using IRT with esignal know how to refresh the chester chart?
(11:33 AM) alvino_60: what are 200 400
(11:34 AM) ROBAIM: the value of the vold 200,000 and 400,000
(11:34 AM) Ken T: RTH R1=70.25
(11:34 AM) alvino_60: ok thx
(11:34 AM) ROBAIM: also like to watch price testing the MAs
"
Now if you really get into the $vold and want to code up the percentage we spoke about in another thread then I'll scan in the Thom hartle notes I have and send them your way...
Please keep us posted on the Vold
Thanks
Bruce
Amazing. 89 MA on a 13 min chart, when price close's above go long/when close below go short works like a charm, I am going to have to back test this I just looked at like 10 days and +100's points.
How long have you been using this $VOLD?
How long have you been using this $VOLD?
Never Joe....I'm long overdue for an upgrade..glad you find it interesting though
Try e-signal, I think I saw D.T. with a free trail, all you have to pay for is the CME data I think its like the price of a good stake. I bought more cons every time the $VOLD retraced to the 34ma on the 1min today after the Volume decided which way it wanted to go. And tomorrow I'll have it on a 13min chart with a 89ma, that 13min chart worked good in hindsight and ready to shot some trades at it.
If I didn't have this today I would have sold my longs around 835 and tried to scalp a short but instead I was adding to the longs on pullbacks. I don't know if it works this good every day or I just traded it on a good day, past experience in my life goes like if its too good to be true it is.
If I didn't have this today I would have sold my longs around 835 and tried to scalp a short but instead I was adding to the longs on pullbacks. I don't know if it works this good every day or I just traded it on a good day, past experience in my life goes like if its too good to be true it is.
Good to see a thread about market internals, Thanks Joe! I chart $VOLD & $ADD for nyse & naz. This is an uvol-dvol indicator I use, it only works on SPY & QQQQ A reading of 50 the volume is 1-1 parity, this combined with $ADD candles the number of advancers minus decliners give me a good indication of how bearish or bullish the market is minuites after the open, for me this is much easier than trying to trade by price action alone
Click image for original size
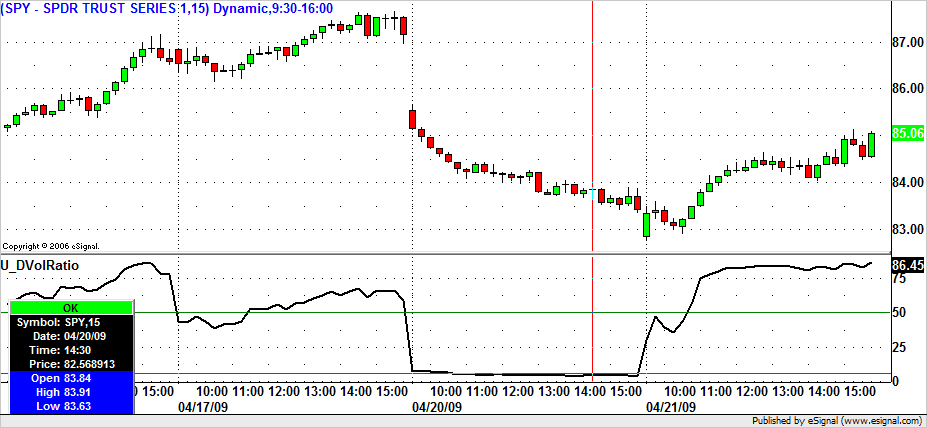
Here is a 13min chart of the $VOLD in candles the ES in bars and the blue line is 89 period ma. Notice the mid afternoon lows the $VOLD got a nice bounce of the 89ma, calling a nice short term low in the ES....
Click image for original size
Its esignal, you can intergrade your trading platform thru there software. I no longer use them, I had problems with lots of data freeze. So I wouldn't use them as a stand alone. fwiw I havn't yet found a platform that I like 100% esignal was great for longer term though. I ran lots of tick charts...but normal charts wouldn't bog it down.
I contacted esignal and they said it was my computer, so I let a pro look at my computer and he said I was only running like .03% of my CPU's so it wasn't on my end.
I contacted esignal and they said it was my computer, so I let a pro look at my computer and he said I was only running like .03% of my CPU's so it wasn't on my end.
Emini Day Trading /
Daily Notes /
Forecast /
Economic Events /
Search /
Terms and Conditions /
Disclaimer /
Books /
Online Books /
Site Map /
Contact /
Privacy Policy /
Links /
About /
Day Trading Forum /
Investment Calculators /
Pivot Point Calculator /
Market Profile Generator /
Fibonacci Calculator /
Mailing List /
Advertise Here /
Articles /
Financial Terms /
Brokers /
Software /
Holidays /
Stock Split Calendar /
Mortgage Calculator /
Donate
Copyright © 2004-2023, MyPivots. All rights reserved.
Copyright © 2004-2023, MyPivots. All rights reserved.