The weekly thread for actual trading opportunities (Futures, Forex, Stocks, ETFs ...) and general market discussions.
Trade well!
JI
jimkane
Rep: 3,058
Posts: 33,089
Now the question for everyone, the 'homework', is why was I looking at 78???
JI
jimkane
Rep: 3,058
Posts: 33,089
And the answer isn't all those swing highs to the left, although I'm sure they were a factor.
JI
jimkane
Rep: 3,058
Posts: 33,089
Wow, look at that dump in crude there on a 13-tick chart. Starting to see that more lately...
SU
sunvalley
Rep: 0
Posts: 7
quote:
Originally posted by jimkane
And the answer isn't all those swing highs to the left, although I'm sure they were a factor.
Anything to do with that reversal thrust around 10:03 on 10/22?
JI
jimkane
Rep: 3,058
Posts: 33,089
That's a great guess. I have a large group of 'secondary' things coming together in the 78 area, and what you mention is one of those. But there's one primary thing that fell right into the area that really had me looking for it to stretch up to there. I'll give one hint, it's a line, not a pattern or Fib. And it's not a set that I usually show as part of my core linework, but it is one we have discussed and seen in here frequently. I probably just gave it away, but we'll see...
RO
roofer
Rep: 3,689
Posts: 3,574
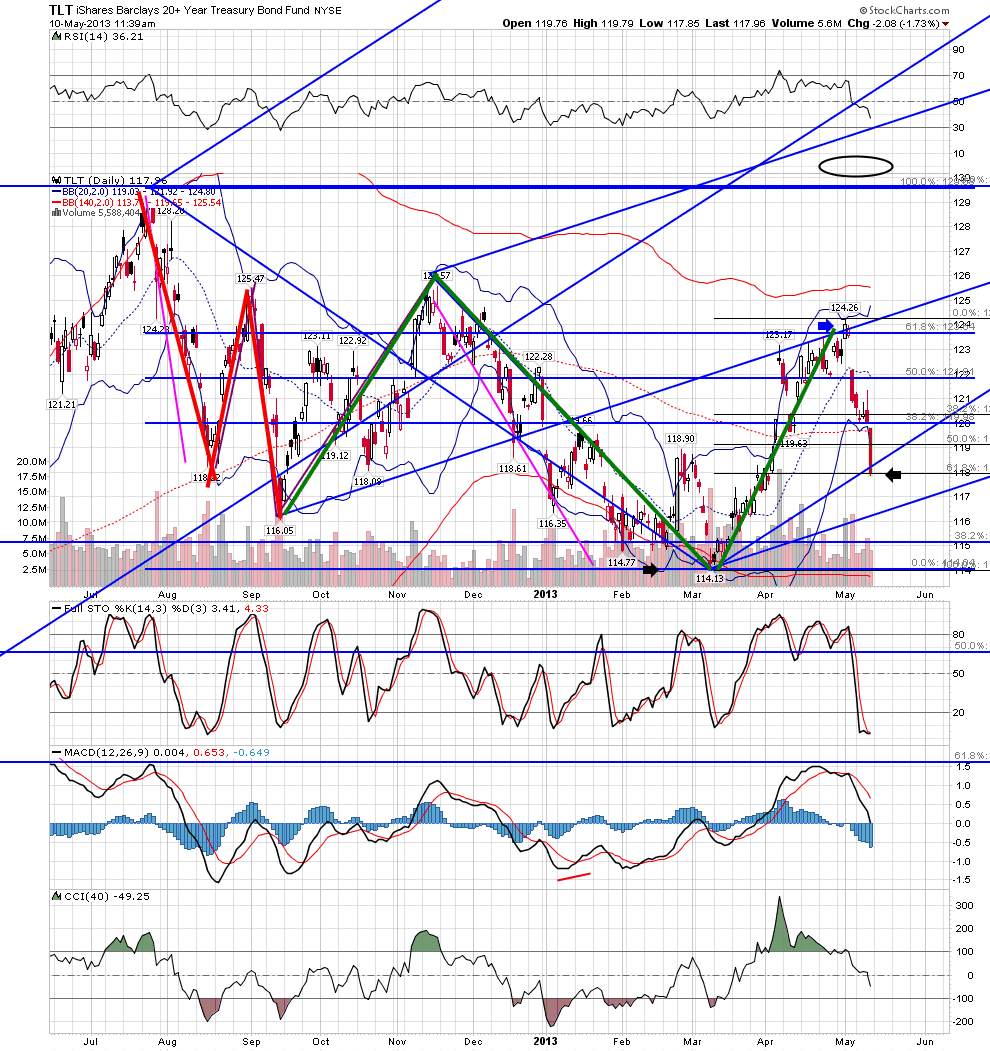
i love trading in december... the big traders are gone for the year and the pure numbers traders take over and run the game...this weeks action in rut is SO decemberish...
Click image for original size
JI
jimkane
Rep: 3,058
Posts: 33,089
Excellent, roofer. Great chart. The action is spectacular. I love it. When one throws the various adjusted sets on there that I do, it gets even more amazing. Like you said, very decemberish.
JI
jimkane
Rep: 3,058
Posts: 33,089
quote:Here's one more hint. The pattern repeats itself in a smaller format into the same LOD area, and the second area for the move off this overlaps with the first for the bigger setup. As it turns out, the second area for the smaller setup was hit to the tick, but I thought it would exceed it a bit and stretch for the bigger setups first area. Wait, maybe that just confused everyone even more. I'll give you all a bit more time on this, and then I'll just have to show it. But, I want to give away the Jimadamus kudos prize to someone, so keep trying.
Originally posted by jimkane
That's a great guess. I have a large group of 'secondary' things coming together in the 78 area, and what you mention is one of those. But there's one primary thing that fell right into the area that really had me looking for it to stretch up to there. I'll give one hint, it's a line, not a pattern or Fib. And it's not a set that I usually show as part of my core linework, but it is one we have discussed and seen in here frequently. I probably just gave it away, but we'll see...
JI
jimkane
Rep: 3,058
Posts: 33,089
Okay, I'll solve the mystery. I probably should have left this for a day to see what anyone might come up with, but I want to finish up my week here, so I'll go ahead.
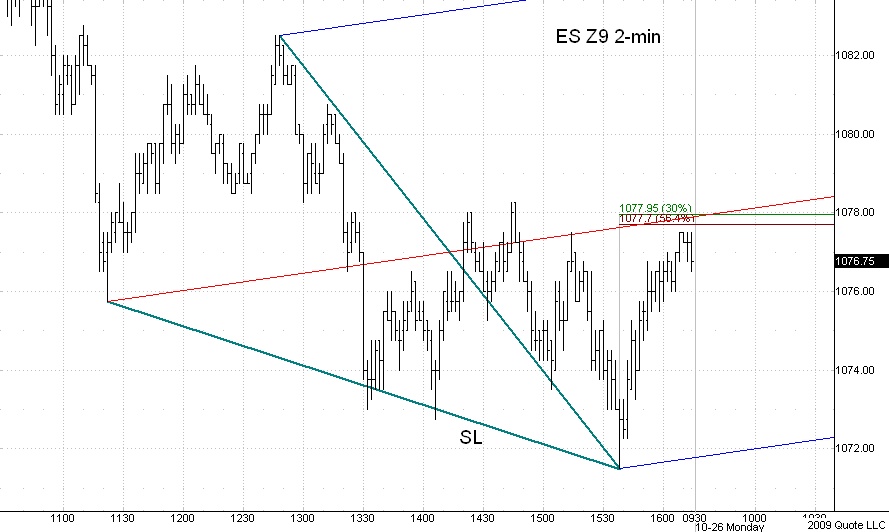
Note that this is not the basis for my trading, only one more factor I can add to my methodology when I see it. SL comes in, so I put the standard SL set on there, and watch the ML. Among many other things, it overlaps with an obvious .300 and .564. Hence the 78 (maybe 77.75?)
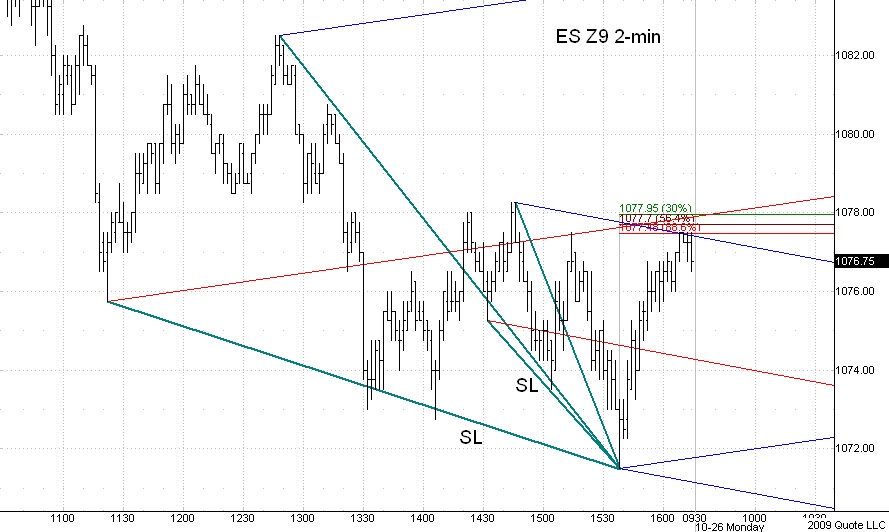
I also noticed another SL and set for that, and the upper // hits at the obvious .886 at 77.50, right in the general area.
It's splitting hairs to try to call these two areas, or to try to find an ES area even as small as two ticks, so in reality all this is one area, and it hit it dead on. I never should have said I was watching 78, instead I should have said 77.75 plus or minus a tick or two, but I really thought it might want to hit that ML dead on and quit right there for the week. So, that's one of the things I was watching for that mystery area...
Charts created on QCharts, courtesy eSignal.
Note that this is not the basis for my trading, only one more factor I can add to my methodology when I see it. SL comes in, so I put the standard SL set on there, and watch the ML. Among many other things, it overlaps with an obvious .300 and .564. Hence the 78 (maybe 77.75?)
Click image for original size
I also noticed another SL and set for that, and the upper // hits at the obvious .886 at 77.50, right in the general area.
Click image for original size
It's splitting hairs to try to call these two areas, or to try to find an ES area even as small as two ticks, so in reality all this is one area, and it hit it dead on. I never should have said I was watching 78, instead I should have said 77.75 plus or minus a tick or two, but I really thought it might want to hit that ML dead on and quit right there for the week. So, that's one of the things I was watching for that mystery area...
Charts created on QCharts, courtesy eSignal.