The weekly thread for actual trading opportunities (Futures, Forex, Stocks, ETFs ...) and general market discussions.
Trade well!
RO
roofer
Rep: 3,689
Posts: 3,574
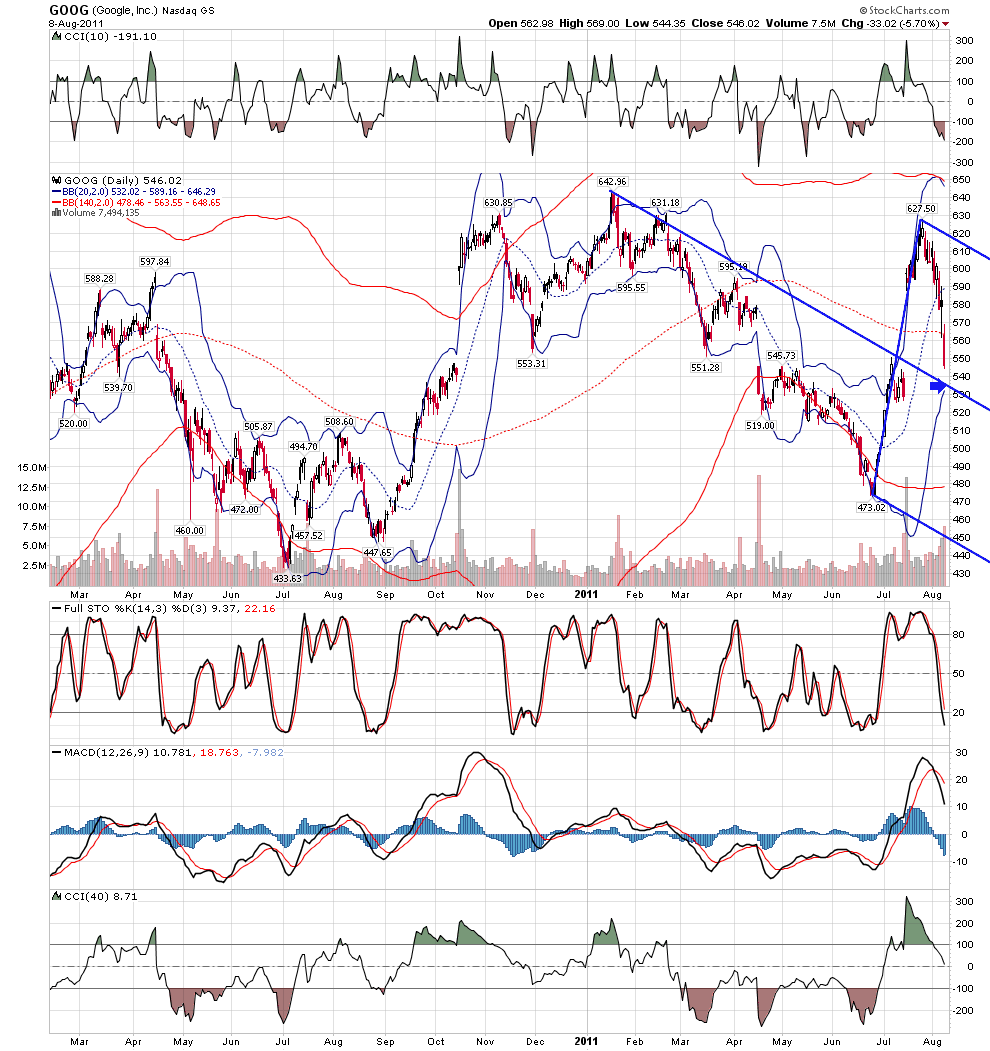
newer students... this was classic pattern line fib straight out of the books
Click image for original size
SH
shmendel
Rep: 0
Posts: 33
Hi Roofer
What does BBS stand for. I learn a lot from your charts...to say the least! Thanks
Stuart
What does BBS stand for. I learn a lot from your charts...to say the least! Thanks
Stuart
JI
jimkane
Rep: 3,058
Posts: 33,089
Yeah, roofer, that's the one I was talking about a few posts back.
shmendel, it's DBS, and stands for 'double barreled shotgun', and refers to an overlap of two 1.272's.
shmendel, it's DBS, and stands for 'double barreled shotgun', and refers to an overlap of two 1.272's.
JA
jarek
Rep: 94
Posts: 3,474
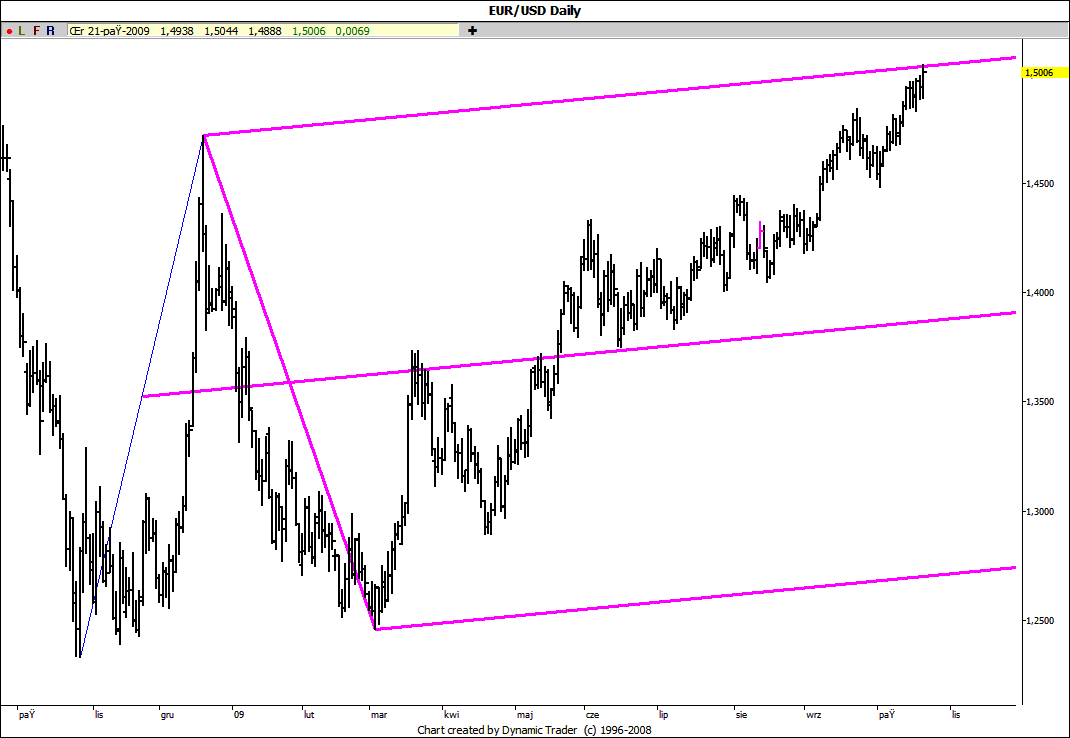
Yesterday EUR/USD reached the upper ML of a large Schiff set giving yet another signal for a possible dollar bottom somewhere here:
Click image for original size
JI
jimkane
Rep: 3,058
Posts: 33,089
The ES run from 13:43 had at least a quadruple line convergence (you can find more if you really search). Everyone should look for those. That was the 'retest' point for the ABCD we all saw at 12:29, dead off a lower //. Now note where the ES is right here, and the most key downsloping upper // right in here.
And crude, once again, going line to line, pattern to pattern, as usual. It just amazes me.
And crude, once again, going line to line, pattern to pattern, as usual. It just amazes me.
JI
jimkane
Rep: 3,058
Posts: 33,089
Yeah, as I mentioned yesterday, the only thing that would surprise me is if the ES wasn't at new 'bull market' highs today. But, to do that, it would be an appx. 30 point ES rise off the LOD, which would be impressive. Take quite a hit to the USD to rise it that much. But, they are blasting the USD nice and hard here, and it isn't too far off from taking out yesterday's low, so they still have a chance at those new ES highs today.
JI
jimkane
Rep: 3,058
Posts: 33,089
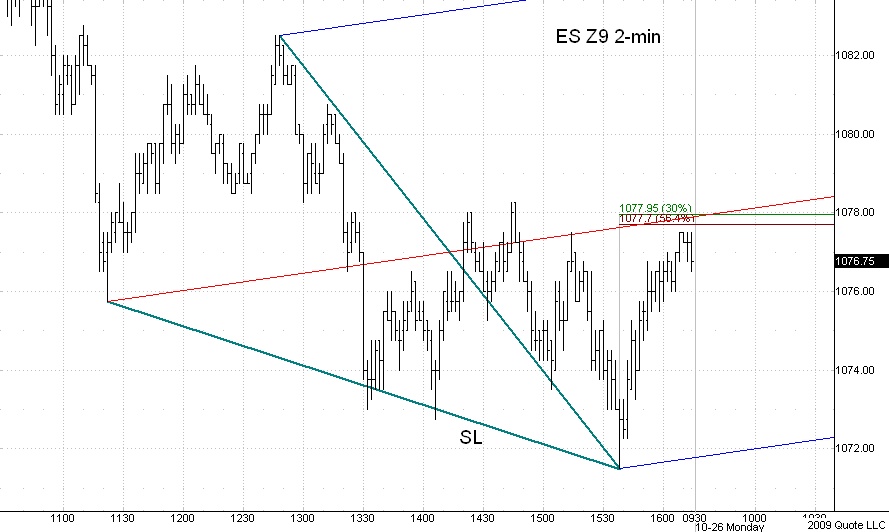
Okay, I'll solve the mystery. I probably should have left this for a day to see what anyone might come up with, but I want to finish up my week here, so I'll go ahead.
Note that this is not the basis for my trading, only one more factor I can add to my methodology when I see it. SL comes in, so I put the standard SL set on there, and watch the ML. Among many other things, it overlaps with an obvious .300 and .564. Hence the 78 (maybe 77.75?)
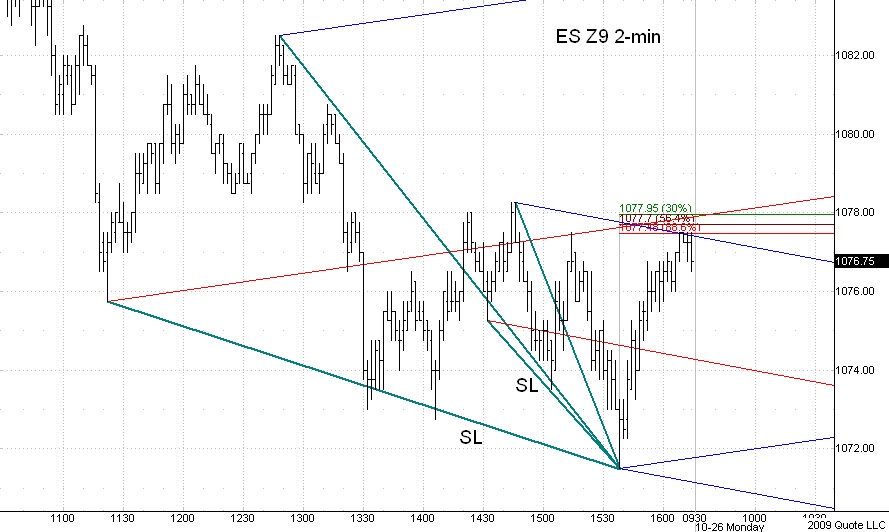
I also noticed another SL and set for that, and the upper // hits at the obvious .886 at 77.50, right in the general area.
It's splitting hairs to try to call these two areas, or to try to find an ES area even as small as two ticks, so in reality all this is one area, and it hit it dead on. I never should have said I was watching 78, instead I should have said 77.75 plus or minus a tick or two, but I really thought it might want to hit that ML dead on and quit right there for the week. So, that's one of the things I was watching for that mystery area...
Charts created on QCharts, courtesy eSignal.
Note that this is not the basis for my trading, only one more factor I can add to my methodology when I see it. SL comes in, so I put the standard SL set on there, and watch the ML. Among many other things, it overlaps with an obvious .300 and .564. Hence the 78 (maybe 77.75?)
Click image for original size
I also noticed another SL and set for that, and the upper // hits at the obvious .886 at 77.50, right in the general area.
Click image for original size
It's splitting hairs to try to call these two areas, or to try to find an ES area even as small as two ticks, so in reality all this is one area, and it hit it dead on. I never should have said I was watching 78, instead I should have said 77.75 plus or minus a tick or two, but I really thought it might want to hit that ML dead on and quit right there for the week. So, that's one of the things I was watching for that mystery area...
Charts created on QCharts, courtesy eSignal.