The weekly thread for actual trading opportunities (Futures, Forex, Stocks, ETFs ...) and general market discussions.
Trade well!
ER
EricD
Rep: 63
Posts: 692
Jimadamus...Jimadamus..oh Jimadamus..there is hat song again....and there are rarely any post in the other topic.
JI
jimkane
Rep: 3,058
Posts: 33,089
I'm really kicking myself, I almost posted the setup for this drop right before it happened, but I just don't feel much like posting lately... It would have been cool if I had, but I guess I've done similar so many times, you all get it by now anyway.
JI
jimkane
Rep: 3,058
Posts: 33,089
What was the setup, Jim? ABCD with an ABCD in BC leg, at key line convergence at a .618. Classic W2. Then it thrusts down and does an EXP W2 as the start to W3, at another line convergence, at a .786, and then the meltdown begins. And if you've seen even a hint to start scaling out yet you haven't learned much from me so far...
JI
jimkane
Rep: 3,058
Posts: 33,089
Sometimes I just get so grouchy I stop mentioning things and ejoying myself posting, and it just frustrates me. Like this comment in regards to crude from earlier today: "Note, too, that a TD that plays out to its 1.272 also usually forms a 3D, and this one did, and then dumped." That maybe wasn't worded too well, saying 'plays out to its 1.272' sounds like it implies this is only applicable to the 1.272, while it is equally valid at a 1.128 or 1.272. Regardless, recall I mentioned the TD best seen on the 13-min (traded timeframe more like a 60-min+). It plays out today to the 1.128, which then forms the 3D. Look at the RTH chart. This forms the basis for the premise, the 'context' to try the short side. 'Context', pattern, setups with multiple patterns, it all came together. Yet not one person mentioned it, even after I described the concept for crude.
Okay, all my mentor students surely see what the price action just did here into this key area here, right? It should reverse up sharply here. If it doesn't, that's a big clue. Climax selling on volume to a key area with a chart signature to end the move. If it doesn't end the selling, what does that say?
Okay, all my mentor students surely see what the price action just did here into this key area here, right? It should reverse up sharply here. If it doesn't, that's a big clue. Climax selling on volume to a key area with a chart signature to end the move. If it doesn't end the selling, what does that say?
JI
jimkane
Rep: 3,058
Posts: 33,089
Can't do a thing with a key area, a double ending move chart signature, nothing. I'd love to say maybe that's the sea change, the top is finally in, finished with a classic 3D. In 'the old days' I'd say that was the case. But in these days of manipulation, the only thing that would surprise me is if we aren't at new 'bull market' highs tomorrow.
The one thing that I will say that favors that being to top is that everyone is waiting for the low 1,100's area. We hit 1099. No one thinks it could possibly be over here. I think it is either over here, or it goes a lot higher. Until the March low where every pundit with a zero track record hit the low to the day and the point, I'd say no way the low 1,100's area everyone is talking about will do anything, but in a fake environment, who knows. So, one way to chump them all out is for it to drop here, hard and fast so that none of those waiting to short there even get a chance without chasing big time. We'll see.
The one thing that I will say that favors that being to top is that everyone is waiting for the low 1,100's area. We hit 1099. No one thinks it could possibly be over here. I think it is either over here, or it goes a lot higher. Until the March low where every pundit with a zero track record hit the low to the day and the point, I'd say no way the low 1,100's area everyone is talking about will do anything, but in a fake environment, who knows. So, one way to chump them all out is for it to drop here, hard and fast so that none of those waiting to short there even get a chance without chasing big time. We'll see.
JI
jimkane
Rep: 3,058
Posts: 33,089
Would have been better if I pointed it out ahead of time like I usually do, but my motivation is just gone. I saw it and said why bother. I know the few of you who are in here are trying your best, and that's good, but when I really get going and do five pages of great posts and I look back and see I was it, I just get so frustrated. Damn, I'm just so grouchy lately...
SH
shmendel
Rep: 0
Posts: 33
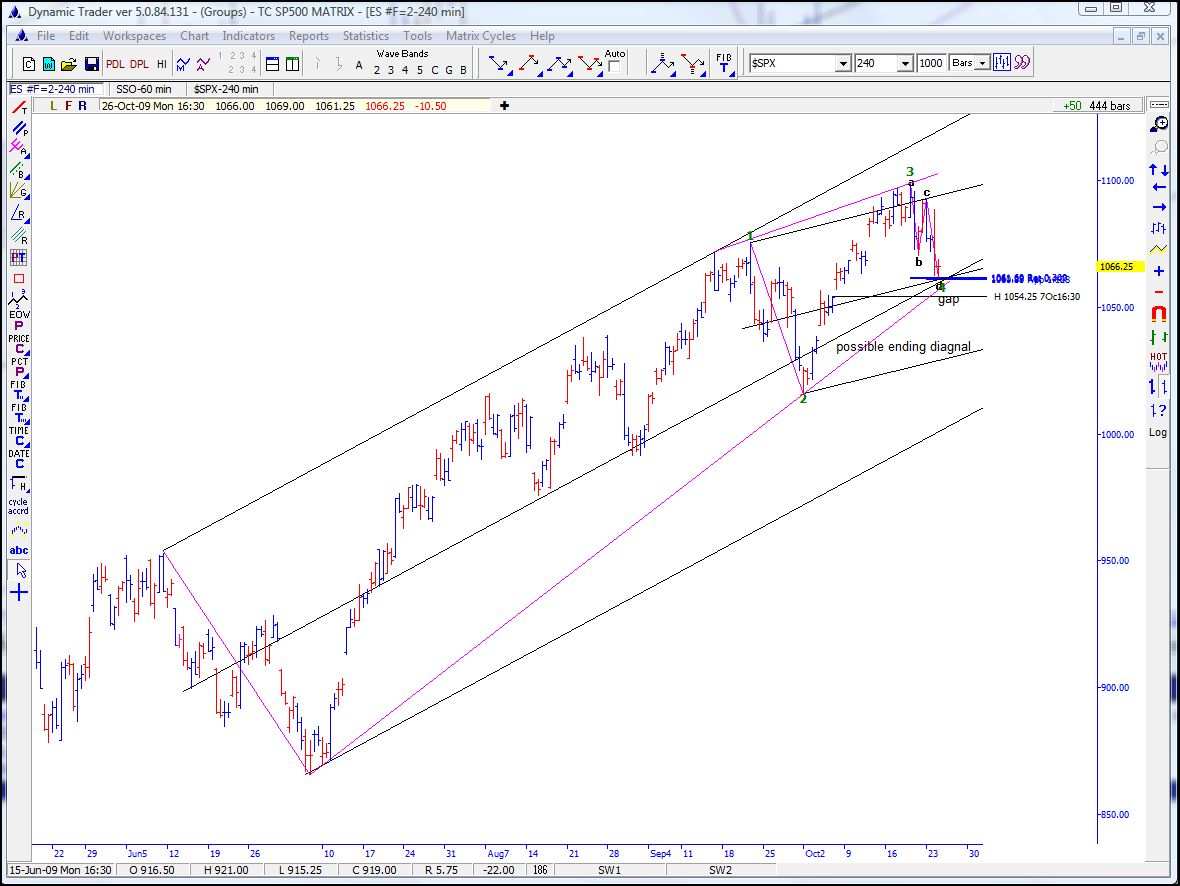
My first post. Just trying to contribute by putting Jim's words to picture. I'm sure I've missed a bunch of lines but this sure is beautiful.
Stuart
Stuart
Click image for original size
RO
roofer
Rep: 3,689
Posts: 3,574
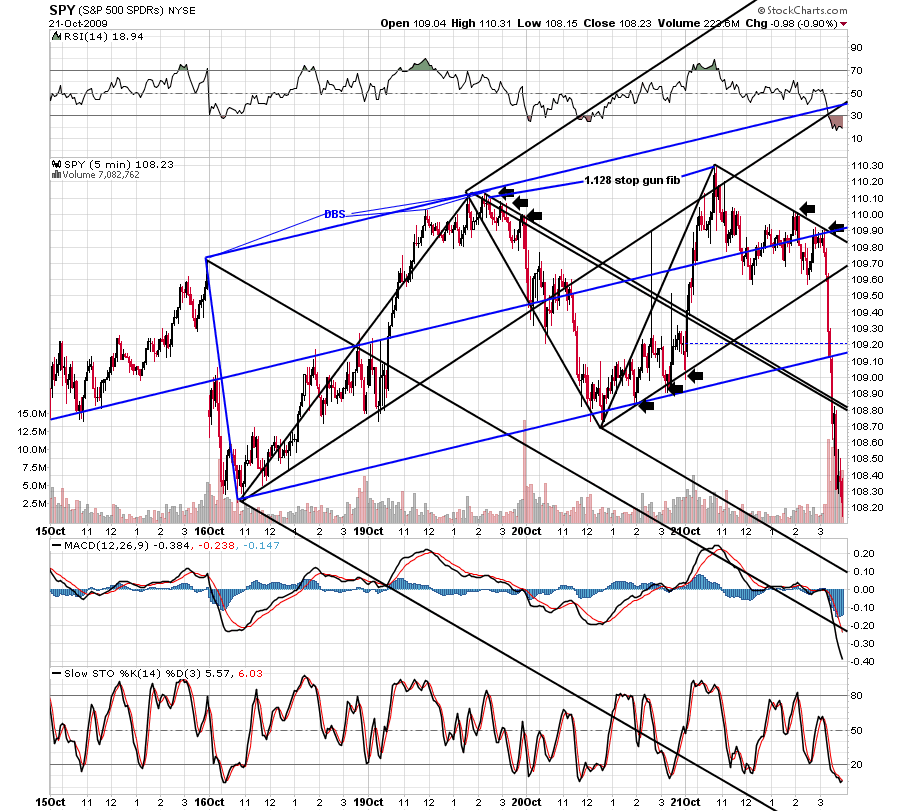
MY ONE STUDENT, who i sent out on his own months ago, who had the limitation that no prop kane would be shared, has been doing well with the simple concepts... here is a copy of his chart he sent me....
Click image for original size
JI
jimkane
Rep: 3,058
Posts: 33,089
Okay, I'll solve the mystery. I probably should have left this for a day to see what anyone might come up with, but I want to finish up my week here, so I'll go ahead.
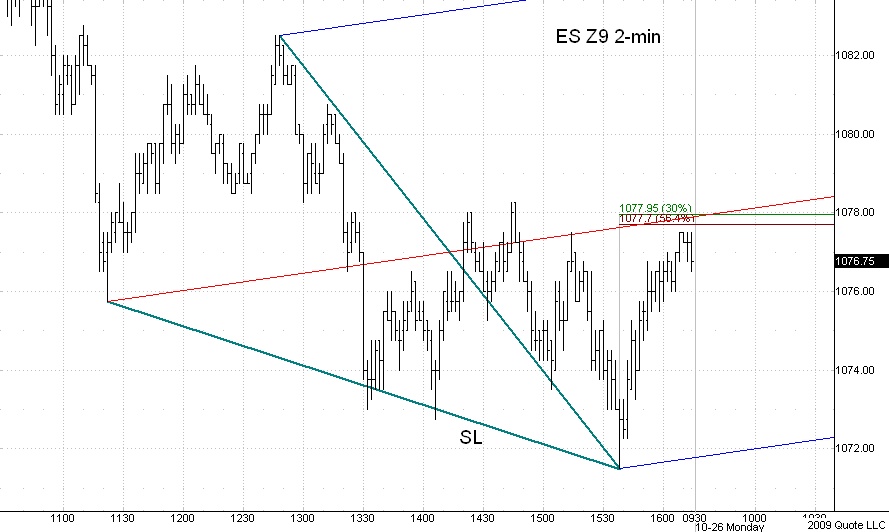
Note that this is not the basis for my trading, only one more factor I can add to my methodology when I see it. SL comes in, so I put the standard SL set on there, and watch the ML. Among many other things, it overlaps with an obvious .300 and .564. Hence the 78 (maybe 77.75?)
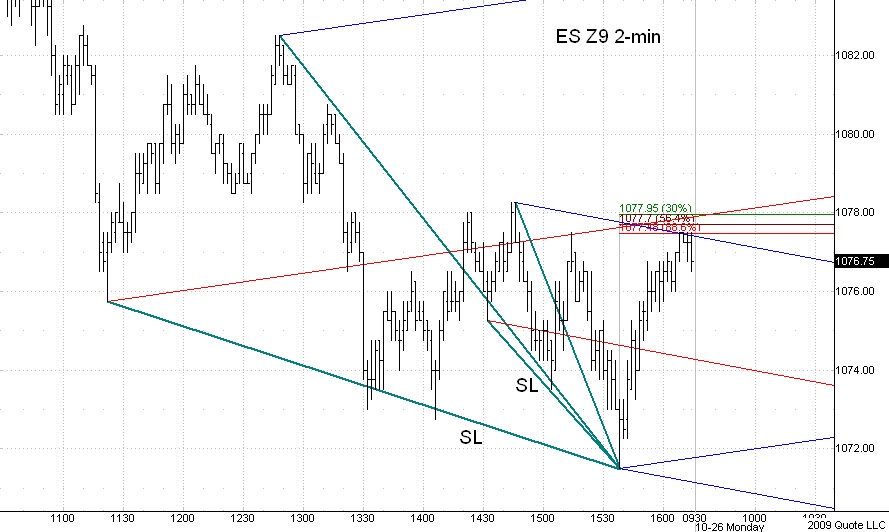
I also noticed another SL and set for that, and the upper // hits at the obvious .886 at 77.50, right in the general area.
It's splitting hairs to try to call these two areas, or to try to find an ES area even as small as two ticks, so in reality all this is one area, and it hit it dead on. I never should have said I was watching 78, instead I should have said 77.75 plus or minus a tick or two, but I really thought it might want to hit that ML dead on and quit right there for the week. So, that's one of the things I was watching for that mystery area...
Charts created on QCharts, courtesy eSignal.
Note that this is not the basis for my trading, only one more factor I can add to my methodology when I see it. SL comes in, so I put the standard SL set on there, and watch the ML. Among many other things, it overlaps with an obvious .300 and .564. Hence the 78 (maybe 77.75?)
Click image for original size
I also noticed another SL and set for that, and the upper // hits at the obvious .886 at 77.50, right in the general area.
Click image for original size
It's splitting hairs to try to call these two areas, or to try to find an ES area even as small as two ticks, so in reality all this is one area, and it hit it dead on. I never should have said I was watching 78, instead I should have said 77.75 plus or minus a tick or two, but I really thought it might want to hit that ML dead on and quit right there for the week. So, that's one of the things I was watching for that mystery area...
Charts created on QCharts, courtesy eSignal.