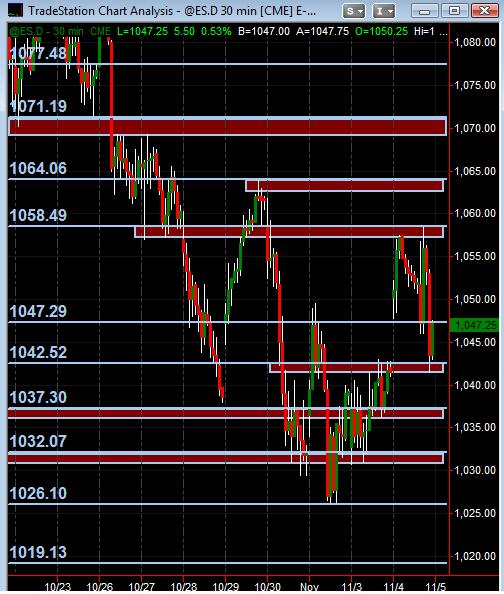
ES S/R Map for 11/5/09
On the gf's computer once again ... but after watching price action during the session today and looking at charts on multiple time frames ... this is what I distilled down as potential significant price levels for Thursday. 1047-1047.50 is a "minor" area (should have noted that on the chart).
Hope this is helpful ... and open to feedback and analysis from all. Let's share some ideas here ... good stuff!
Click image for original size
Hope this is helpful ... and open to feedback and analysis from all. Let's share some ideas here ... good stuff!
short 56.00 w/2point stop ... may tighten if doesn't drop quick ... was fading this 57.00 area ... scratched out of trade @56.50 ... mkt still acting too strong to me at least
57-58.50 seems like a reasonable area to consider short if tape and 1min chart weren't so strong ... next price level up that I'm looking at if it gets there is 64.00 ... would expect more signif resistance but would wait for price action (tape) to confirm and give a place to enter
mkt has been trending up on 5min chart for both ES and NQ since 3 Central Time on globex is part of my long bias and also the current price activity so far this morning ... may consider another long for a scalp (though we're kind of extended on really short term) ... so will most likely sit on hands for now and see how price acts in this 57-58.50 area unfolds
hmmm ... I'm micro babbling here ... gonna stick to a little bigger picture analysis on intraday time frame as I don't see too much very useful in prior few posts ... espec. since I tend to scalp and for short short term, market read and analysis close-up can change so quickly.
will try to stick to more rationale for observations and for higher probability areas for potential decent trading areas on chart
will try to stick to more rationale for observations and for higher probability areas for potential decent trading areas on chart
As i said before... 1063.25-1063.75, and eventually 1073
that 56 - 58 of you folks is the big attractor today..I wouldn't be surprised to see another late day retest..there is a gap ( small) at 57 so I'm avoiding all long ideas ..I'd rather miss the long if it happens and besides, my 62 is stil there up top
BINGO!!!!! THERES OUR 1063
ah Kool..ur slipping...missed that 63.25 by .25...lol...nice when our worlds collide..now clean up that 57...they never make that one easy...like to make me suffer for trading so late in the day
MY ORDER WAS AT 1063.25 AND 1063.75,BRUCE! I WAITED 4 DAYS FOR THAT ONLY TO GET ONE TICKED!!! USUALLY IF 1073 IS OING TO BE SEEN IN A DAY OR SO YOU WOULD THINK IF ANY THING IT WOULD SLIGHTLY OVERSHOOT THE PROJECTION, INDICATING HIGHER PRICES LATER! IM SO BUMMED ..GOING TO SLEEP NOW.
quote:
Originally posted by koolblue
TOMORROW IS UNEMPLOYMENT DAY!!! And something to keep in mind. This could be one of those days that drives newbies wacky!...a small decline into the report, then great unemployment news comes out , causeing a pop back up to 1073,or even 1076.75!!! Then just as suddenly the market reverses as everyone remembers that Bennie and the Feds just said they wont consider raising rates till unemployment improves!! Remember? so perversly, they then decline the thing the rest of the day!!! lol... just thinking out loud!..but i wonder!?!
The reason for the chop is that good data (good for the indices) has been triggering the purchase of U.S. bonds to offset a declining dollar.
Emini Day Trading /
Daily Notes /
Forecast /
Economic Events /
Search /
Terms and Conditions /
Disclaimer /
Books /
Online Books /
Site Map /
Contact /
Privacy Policy /
Links /
About /
Day Trading Forum /
Investment Calculators /
Pivot Point Calculator /
Market Profile Generator /
Fibonacci Calculator /
Mailing List /
Advertise Here /
Articles /
Financial Terms /
Brokers /
Software /
Holidays /
Stock Split Calendar /
Mortgage Calculator /
Donate
Copyright © 2004-2023, MyPivots. All rights reserved.
Copyright © 2004-2023, MyPivots. All rights reserved.